
Datasets
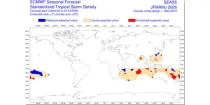
The ECMWF seasonal forecasts (SEAS5) are produced every month with a 51-member ensemble at a ...
Interval/period: N/A
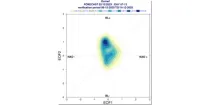
These diagrams show the evolution of regimes indicative of likely weather by week around ...
Interval/period: N/A
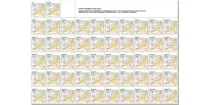
These charts show MSLP and 850hPa forecasts for the Ensemble Control Forecast, and 50 ENS ...
Interval/period: N/A
Potential vorticity (PV) helps description and understanding of dynamic processes in the atmosphere by giving an indication of ascending or descending air flows and the development or weakening of ...
Interval/period: N/A
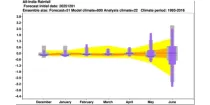
The ECMWF seasonal forecasts (SEAS5) are produced every month with a 51-member ensemble at ...
Interval/period: N/A
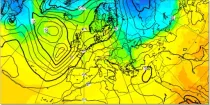
GraphCast (Google DeepMind): a deep learning-based system developed by Google DeepMind.It is initialised with ECMWF analysis. GraphCast operates at 0.25° resolution.
Interval/period: N/A
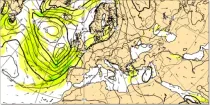
GraphCast (Google DeepMind): a deep learning-based system developed by Google DeepMind.It is initialised with ECMWF analysis. GraphCast operates at 0.25° resolution.
Interval/period: N/A
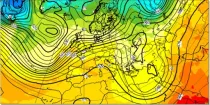
Pangu-Weather: a deep learning-based system developed by Huawei. It is initialised with ECMWF analysis. Pangu-Weather operates at 0.25° resolution.
Interval/period: N/A
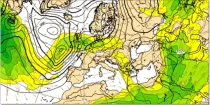
Pangu-Weather: a deep learning-based system developed by Huawei. It is initialised with ECMWF analysis. Pangu-Weather operates at 0.25° resolution.
Interval/period: N/A
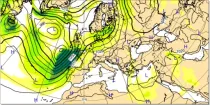
Pangu-Weather: a deep learning-based system developed by Huawei. It is initialised with ECMWF analysis. Pangu-Weather operates at 0.25° resolution.
Interval/period: N/A
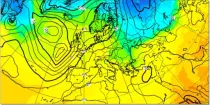
Pangu-Weather: a deep learning-based system developed by Huawei. It is initialised with ECMWF analysis. Pangu-Weather operates at 0.25° resolution.
Interval/period: N/A
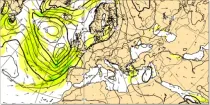
Pangu-Weather: a deep learning-based system developed by Huawei. It is initialised with ECMWF analysis. Pangu-Weather operates at 0.25° resolution.
Interval/period: N/A
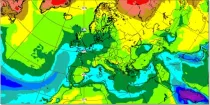
Specific humidity gives an indication of the amount of moisture within a sample of air (in g of water vapour within a kg of air, g kg⁻¹). The chart shows the specific humidity at 1000 hPa and 925 hPa levels and...
Interval/period: N/A
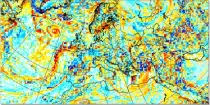
Vorticity is the tendency of an air particle to rotate or circulate around a particular point. Relative Vorticity is a measure about a vertical axis of the local rotation or spin of the air relative...
Interval/period: N/A
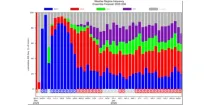
This diagram shows daily probabilities for four types of Euro-Atlantic weather regimes over ...
Interval/period: N/A
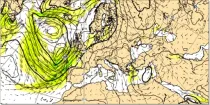
The air flow is not the same at all levels and can be very different in strength and direction when associated with vigorous weather systems...
Interval/period: N/A
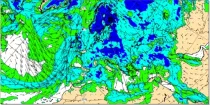
Uncoloured areas (relative humidity < 65%) are likely to be free of cloud. Coloured areas (relative humidity > 65%) show where moisture is likely to be available for cloud development...
Interval/period: N/A
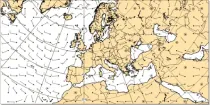
This chart shows 7-day mean anomalies of wind speed and direction from the ECMWF Sub-seasonal ...
Interval/period: N/A