
Datasets
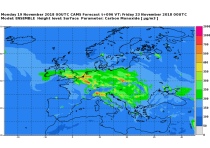
This dataset provides daily air quality analyses and forecasts for Europe.
Interval/period: N/A
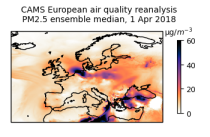
This dataset provides annual air quality reanalyses for Europe based on both unvalidated (interim) and validated observations.
Interval/period: N/A
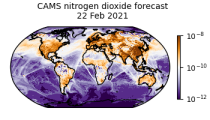
CAMS produces global forecasts for atmospheric composition twice a day. The forecasts consist of more than 50 chemical species (e.g. ozone, nitrogen dioxide, carbon monoxide) and seven different types of aerosol (desert dust, sea salt, organic matter, black carbon, sulphate, nitrate and ammonium aerosol). In addition, several meteorological variables are available as well.
Interval/period: N/A
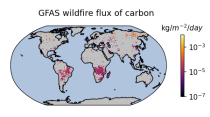
Emissions of atmospheric pollutants from biomass burning and vegetation fires are key drivers of the evolution of atmospheric composition, with a high degree of spatial and temporal variability, and an accurate representation of them in models is essential.
Interval/period: N/A
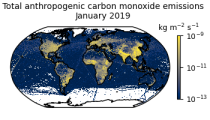
This data set contains gridded distributions of global anthropogenic and natural emissions.
Interval/period: N/A
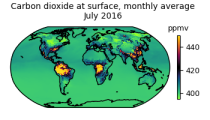
This dataset is part of the ECMWF Atmospheric Composition Reanalysis focusing on long-lived greenhouse gases: carbon dioxide (CO2) and methane (CH4). The emissions and natural fluxes at the surface are crucial for the evolution of the long-lived greenhouse gases in the atmosphere. In this dataset the CO2 fluxes from terrestrial vegetation are modelled in order to simulate the variability across a wide range of scales from diurnal to inter-annual.
Interval/period: N/A
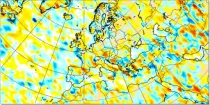
Divergence of horizontal air flow or winds is a measure of the spreading out of air at a particular point. Divergence is +ve where air spreads out; –ve where air converges...
Interval/period: N/A
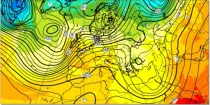
The 850 hPa level is usually just above the boundary layer and at this level the day-night variation in temperature is generally negligible...
Interval/period: N/A
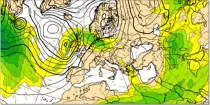
Wind speed at 200 hPa highlights the jet stream (areas of strong winds in the upper troposphere) which can help identify movement and development of depressions...
Interval/period: N/A
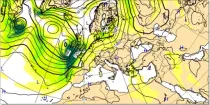
Wind speeds near the surface are roughly proportional to the distance between isobars so closely packed isobars mean strong surface winds...
Interval/period: N/A
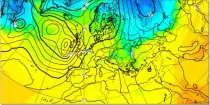
In the northern hemisphere the air rotates anti-clockwise around low contour centres and clockwise around the high contour centres. In the southern hemisphere the air rotates clockwise around low contour centres and ...
Interval/period: N/A
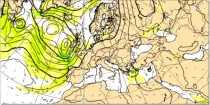
The air flow is not the same at all levels and can be very different in strength and direction when associated with vigorous weather systems...
Interval/period: N/A
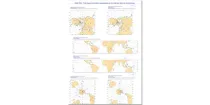
These charts show the difference between the latest HRES Long Window Data Analysis (LWDA) for the main synoptic hours of 00, 06, 12 and 18UTC, and its corresponding background field taken from the previous HRES LWDA run with the same validity time...
Interval/period: N/A
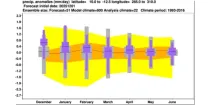
The ECMWF seasonal forecasts (SEAS5) are produced every month with a 51-member ensemble at ...
Interval/period: N/A
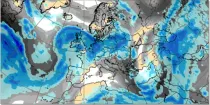
The CAT (Clear Air Turbulence) parameter is given in units of the turbulent Eddy Dissipation ...
Interval/period: N/A
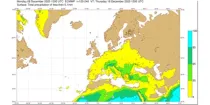
These charts show probabilities of multi-day precipitation accumulation. ...
Interval/period: N/A
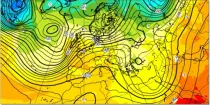
The 850 hPa level is usually just above the boundary layer and at this level the day-night variation in temperature is generally negligible...
Interval/period: N/A
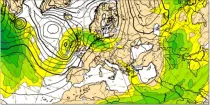
Wind speed at 200 hPa highlights the jet stream (areas of strong winds in the upper troposphere) which can help identify movement and development of depressions...
Interval/period: N/A
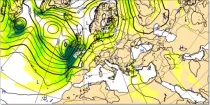
Wind speeds near the surface are roughly proportional to the distance between isobars so closely packed isobars mean strong surface winds...
Interval/period: N/A
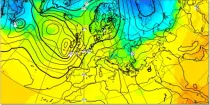
In the northern hemisphere the air rotates anti-clockwise around low contour centres and clockwise around the high contour centres. In the southern hemisphere the air rotates clockwise around low contour centres and ...
Interval/period: N/A
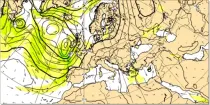
The air flow is not the same at all levels and can be very different in strength and direction when associated with vigorous weather systems...
Interval/period: N/A
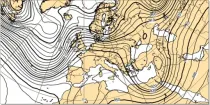
AIFS ENS: a deep learning-based system developed by ECMWF. It is initialised with ECMWF perturbed forecasts and operates at N320 (~0.25Deg) resolution
Interval/period: N/A
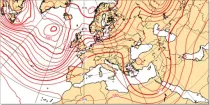
AIFS ENS: a deep learning-based system developed by ECMWF. It is initialised with ECMWF perturbed forecasts and operates at N320 (~0.25Deg) resolution
Interval/period: N/A
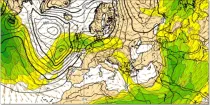
Wind speed at 200 hPa highlights the jet stream (areas of strong winds in the upper troposphere) which can help identify movement and development of depressions...
Interval/period: N/A
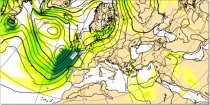
Wind speeds near the surface are roughly proportional to the distance between isobars so closely packed isobars mean strong surface winds...
Interval/period: N/A