Datasets
The CAT (Clear Air Turbulence) parameter is given in units of the turbulent Eddy Dissipation ...
Interval/period: N/A
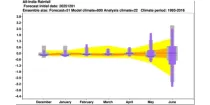
These charts show probabilities of multi-day precipitation accumulation. ...
Interval/period: N/A

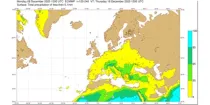
The ECMWF seasonal forecasts (SEAS5) are produced every month with a 51-member ensemble at a ...
Interval/period: N/A
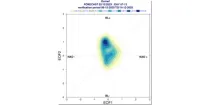
These diagrams show the evolution of regimes indicative of likely weather by week around ...
Interval/period: N/A
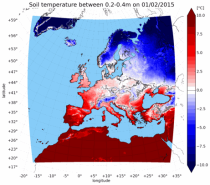
combined with observations using the UERRA-HARMONIE system and MESCAN-SURFEX system.
UERRA-HARMONIE is a 3-dimensional data assimilation system, whereas
MESCAN-SURFEX is a complementary surface analysis system. In general, the
assimilation systems are able to estimate biases between observations and to
sift good-quality data from poor data. The laws of physics allow for estimates
Interval/period: Thu, 10/18/2018 - Wed, 07/31/2019
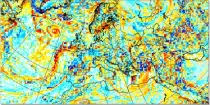
Vorticity is the tendency of an air particle to rotate or circulate around a particular point. Relative Vorticity is a measure about a vertical axis of the local rotation or spin of the air relative...
Interval/period: N/A
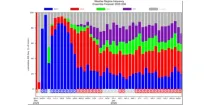
This diagram shows daily probabilities for four types of Euro-Atlantic weather regimes over ...
Interval/period: N/A
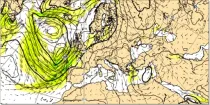
The air flow is not the same at all levels and can be very different in strength and direction when associated with vigorous weather systems...
Interval/period: N/A
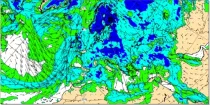
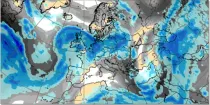
Uncoloured areas (relative humidity < 65%) are likely to be free of cloud. Coloured areas (relative humidity > 65%) show where moisture is likely to be available for cloud development...
Interval/period: N/A
This chart shows 7-day mean anomalies of wind speed and direction from the ECMWF Sub-seasonal ...
Interval/period: N/A
River discharge
Volumetric soil moisture
Snow water equivalent
Soil wetness index (root zone)
Runoff water equivalent (surface plus subsurface)
Interval/period: Thu, 10/11/2018 - Mon, 04/06/2026

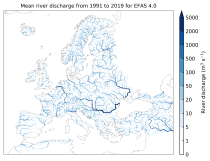
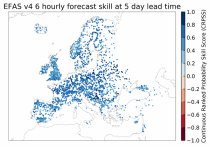
This dataset provides gridded modelled hydrological time series forced with medium-range meteorological forecasts. The data is a consistent representation of the most important hydrological variables across the European Flood Awareness System (EFAS) domain. The temporal resolution is sub-daily high-resolution and ensemble forecasts of:
River discharge
Soil moisture for three soil layers
Snow water equivalent
Interval/period: N/A
River discharge
Soil wetness index (root zone)
Snow water equivalent
Runoff water equivalent (surface plus subsurface)
Interval/period: Tue, 11/05/2019 - Thu, 05/07/2026

River discharge
Volumetric soil moisture
Snow water equivalent
Soil wetness index (root zone)
Runoff water equivalent (surface plus subsurface)
Interval/period: Tue, 01/01/1991 - Tue, 05/05/2026
River discharge
Soil wetness index (root zone)
Snow water equivalent
Runoff water equivalent (surface plus subsurface)
Interval/period: Mon, 01/01/1979 - Tue, 05/05/2026
River discharge
Volumetric soil moisture
Snow water equivalent
Soil wetness index (root zone)
Runoff water equivalent (surface plus subsurface)
Interval/period: Wed, 10/14/2020 - Tue, 05/12/2026

Interval/period: Sun, 01/03/1999 - Sat, 11/25/2023

The ECMWF seasonal forecasts (SEAS5) are produced every month with a 51-member ensemble at a ...
Interval/period: N/A

The ECMWF seasonal forecasts (SEAS5) are produced every month with a 51-member ensemble at a ...
Interval/period: N/A

The charts show mean frequency and accumulated cyclone energy of tropical storm activity. ...
Interval/period: N/A

This chart provides information on the verification of forecasts of the expected number of ...
Interval/period: N/A

The charts show the evolution of existing and potential tropical cyclone activity. ...
Interval/period: N/A
The ECMWF seasonal forecasts (SEAS5) are produced every month with a 51-member ensemble at ...
Interval/period: N/A
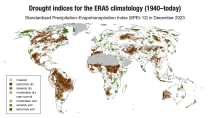
The dataset comprises two standardised drought indices:
- the Standardised Precipitation Index (SPI)
- the Standardised Precipitation-Evapotranspiration Index (SPEI).
Interval/period: Mon, 01/01/1940 - Sun, 03/01/2026
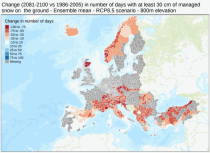
Interval/period: Sun, 01/01/1950 - Fri, 01/01/2100