Displaying 101 - 125 of 148
The Copernicus European Regional ReAnalysis (CERRA) datasets provide spatially and temporally consistent historical reconstructions of meteorological variables in the atmosphere and at the surface. There are four subsets: single levels (atmospheric and surface quantities), height levels (upper-air fields up to 500m), pressure levels (upper-air fields up to 1hPa) and model levels (native levels of the model). This entry provides reanalysis and forecast data on single levels for Europe from 1984 to present.

calendar_today Interval/period: Sat, 09/01/1984 - Sat, 01/31/2026

The Copernicus European Regional ReAnalysis Land (CERRA-Land) dataset provides spatially and temporally consistent historical reconstructions of surface and soil variables at the same horizontal resolution as the CERRA high-resolution reanalysis.

calendar_today Interval/period: Sat, 09/01/1984 - Thu, 07/31/2025

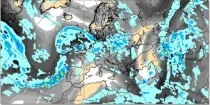
The CAT (Clear Air Turbulence) parameter is given in units of the turbulent Eddy Dissipation Rate (EDR), product shows EDR values on selected flight levels overlayed with wind speeds.

calendar_today Interval/period: N/A

open_in_newview in Open Charts
The Copernicus climate change service (C3S) operational energy dataset provides climate and energy indicators for the European energy sector. The climate-relevant indicators for the energy sector considered are: air temperature, precipitation, incoming solar radiation, wind speed at 10 m and 100 m, and mean sea level air pressure. The energy indicators are electricity demand and power generation from various sources: wind (both onshore and offshore), solar and hydro (run-of-river and reservoir) power.

calendar_today Interval/period: Mon, 01/01/1979 - Sun, 03/01/2026

This dataset provides climate and energy indicators for the Europe as part of the Copernicus climate change service (C3S) Energy operational service. The climate-relevant indicators for the energy sector considered are: air temperature, precipitation, incoming solar radiation, wind speed at 10 m and 100 m, and mean sea level air pressure. The energy indicators are electricity demand and power generation from various sources: wind (both onshore and offshore), solar and hydro (run-of-river and reservoir) power.

calendar_today Interval/period: N/A

The Pan-European Climate Database (PECD) provides information on climate and renewable energy variables for both historical and future time periods. For historical data, the ERA5 global reanalysis serves as the underlying climate data, while future projections are based on selected CMIP6 global climate models. The raw climate model data are further processed through downscaling to achieve higher spatial and temporal resolution and by applying bias adjustment.

calendar_today 
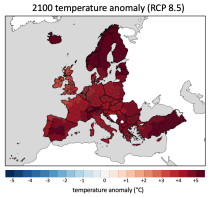
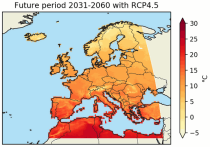
Interval/period: Sun, 01/01/1950 - Wed, 12/01/2100

This dataset provides a series of climate indices derived from reanalysis and model simulations data hosted on the Copernicus Climate Data Store (CDS). These indicators describe how climate variability and change of essential climate variables can impact sectors such as health, agriculture, forestry, energy, tourism, or water and coastal management.

calendar_today Interval/period: Mon, 01/01/1940 - Fri, 12/31/2100

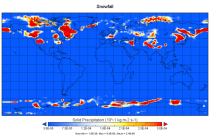
Cloud base height is derived by upwardly searching the structure of the model atmosphere to find the altitude where the cloud fraction becomes >1% and...

calendar_today Interval/period: N/A

open_in_newview in Open Charts
This catalogue entry provides daily climate projections on pressure levels from a large number of experiments, models, members and time periods computed in the framework of fifth phase of the Coupled Model Intercomparison Project (CMIP5). The term "pressure levels" is used to express that the variables were computed at multiple vertical levels, which may differ in number and location among the different models.

calendar_today Interval/period: Sun, 01/01/1860 - Mon, 12/31/2300

This catalogue entry provides daily climate projections on single levels from a large number of experiments, models, members and time periods computed in the framework of the fifth phase of the Coupled Model Intercomparison Project (CMIP5). The term "single levels" is used to express that the variables are computed at one vertical level which can be surface (or a level close to the surface) or a dedicated pressure level in the atmosphere. Multiple vertical levels are excluded from this catalogue entry.

calendar_today Interval/period: Wed, 01/01/1800 - Fri, 12/31/2100

This catalogue entry provides monthly climate projections on pressure levels from a large number of experiments, models, members and time periods computed in the framework of the fifth phase of the Coupled Model Intercomparison Project (CMIP5). The term "pressure levels" is used to express that the variables were computed at multiple vertical levels, which may differ in number and location among the different models.

calendar_today Interval/period: Sun, 01/01/1860 - Mon, 12/31/2300

This catalogue entry provides monthly climate projections on single levels from a large number of experiments, models, members and time periods computed in the framework of fifth phase of the Coupled Model Intercomparison Project (CMIP5). The term "single levels" is used to express that the variables are computed at one vertical level which can be surface (or a level close to the surface) or a dedicated pressure level in the atmosphere. Multiple vertical levels are excluded from this catalogue entry.

calendar_today Interval/period: Sun, 01/01/1860 - Mon, 12/31/2300

This catalogue entry provides daily and monthly global climate projections data from a large number of experiments, models and time periods computed in the framework of the sixth phase of the Coupled Model Intercomparison Project (CMIP6).
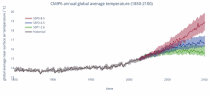
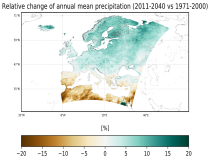
CMIP6 data underpins the Intergovernmental Panel on Climate Change 6th Assessment Report. The use of these data is mostly aimed at:

addressing outstanding scientific questions that arose as part of the IPCC reporting process;
improving the understanding of the climate system;

calendar_today Interval/period: Sun, 01/01/1860 - Mon, 12/31/2300

This catalogue entry provides daily and monthly global climate model data from Decadal Climate Predictions Project (DCPP) experiments, part of the sixth phase of the Coupled Model Intercomparison Project (CMIP6). The decadal data in the Climate Data Store (CDS) are a quality-controlled subset of the full DCPP.

calendar_today Interval/period: Sun, 01/01/1860 - Mon, 12/31/2300

ERA5 is the fifth generation ECMWF atmospheric reanalysis of the global climate covering the period from January 1940 to present. It is produced by the Copernicus Climate Change Service (C3S) at ECMWF and provides hourly estimates of a large number of atmospheric, land and oceanic climate variables. The data cover the Earth on a 31km grid and resolve the atmosphere using 137 levels from the surface up to a height of 80km. ERA5 includes an ensemble component at half the resolution to provide information on synoptic uncertainty of its products.

calendar_today Interval/period: Sat, 01/01/1949 - Wed, 05/13/2026

The Surface Radiation Budget (SRB) represents the balance between the heating of the Earth’s surface through absorption of incoming solar radiation and cooling through the emission of infra-red radiation, which is a fundamental component of the surface energy budget. Small changes in the surface radiation budget can lead to large climatological responses, which makes a permanent and precise monitoring indispensable.

calendar_today Interval/period: Mon, 01/01/1979 - Mon, 06/30/2025

This dataset contains a set of synthetic windstorm events consisting of 22,980 individual storm footprints over Europe. These are a physically realistic set of plausible windstorm events based on the modelled climatic conditions. It is not designed to reproduce actual historical observations but as a comparator for the stochastic event sets generally used for windstorm risk analysis in the insurance industry. This is because there is no data assimilation process used to align the model output to historical observations.

calendar_today Interval/period: Wed, 01/01/1986 - Wed, 11/30/2011

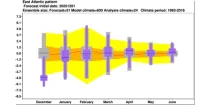
The ECMWF seasonal forecasts (SEAS5) are produced every month with a 51-member ensemble at a ...

calendar_today Interval/period: N/A

open_in_newview in Open Charts

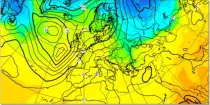
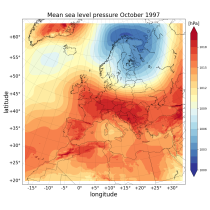
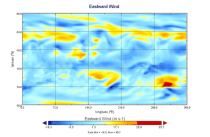
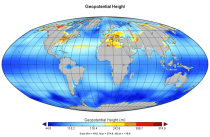
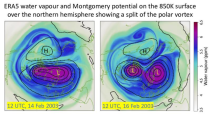
In the northern hemisphere the air rotates anti-clockwise around low contour centres and clockwise around the high contour centres. In the southern hemisphere the air rotates clockwise around low contour centres and ...

calendar_today Interval/period: N/A

open_in_newview in Open Charts
This dataset provides precipitation and near surface air temperature for Europe as Essential Climate Variables (ECVs) and as a set of Climate Impact Indicators (CIIs) based on the ECVs.
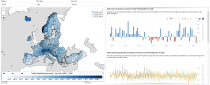
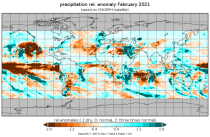
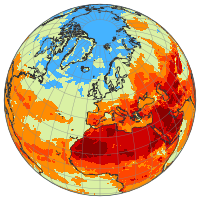
ECV datasets provide the empirical evidence needed to understand the current climate and predict future changes.
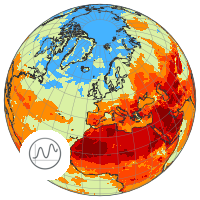
CIIs contain condensed climate information which facilitate relatively quick and efficient subsequent analysis. Therefore, CIIs make climate information accessible to application focussed users within a sector.

calendar_today Interval/period: N/A

This dataset provides high-resolution gridded temperature and precipitation observations from a selection of sources. Additionally the dataset contains daily global average near-surface temperature anomalies. All fields are defined on either daily or monthly frequency. The datasets are regularly updated to incorporate recent observations. The included data sources are commonly known as GISTEMP, Berkeley Earth, CPC and CPC-CONUS, CHIRPS, IMERG, CMORPH, GPCC and CRU, where the abbreviations are explained below.

calendar_today Interval/period: Thu, 01/01/1750 - Fri, 01/01/2021

This dataset contains temperature exposure statistics for Europe (e.g. percentiles) derived from the daily 2 metre mean, minimum and maximum air temperature for the entire year, winter (DJF: December-January-February) and summer (JJA: June-July-August). These statistics were derived within the C3S European Health service and are available for different future time periods and using different climate change scenarios.

calendar_today 
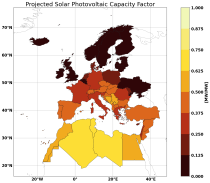
Interval/period: Wed, 01/01/1986 - Mon, 12/31/2085

This dataset provides a complete historical reconstruction for a set of indices representing human thermal stress and discomfort in outdoor conditions. This dataset, also known as ERA5-HEAT (Human thErmAl comforT) represents the current state-of-the-art for bioclimatology data record production.
The dataset is organised around two main variables:

the mean radiant temperature (MRT)
the universal thermal climate index (UTCI)

calendar_today Interval/period: Fri, 12/01/1939 - Sat, 05/02/2026

This catalogue entry provides a time series of thermal comfort indices, organised to make time the primary dimension for analysis and extraction. For any user-defined location (point) or small area, the dataset returns the temporal evolution of the selected variables, enabling efficient time-series studies without requiring users to download and manage full global gridded files.

calendar_today Interval/period: Mon, 01/01/1940 - Fri, 05/09/2025

The International Grand Global Ensemble (TIGGE) dataset consists of global medium-range ensemble forecasts from thirteen numerical weather prediction (NWP) centres.
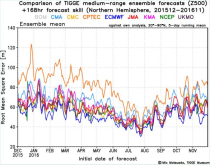
The dataset has been available since October 2006. TIGGE was established as a key component of THORPEX: a World Weather Research Programme to accelerate the improvements in the accuracy of 1-day to 2 week high-impact weather forecasts (THORPEX stands for THe Observing system Research and Predictability EXperiment)

calendar_today Interval/period: Sun, 10/01/2006 - Wed, 05/06/2026