Datasets
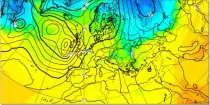
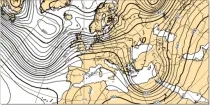
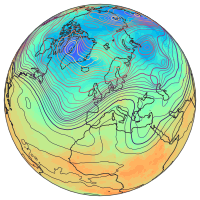
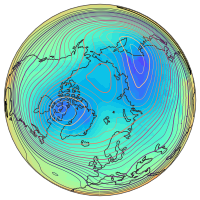
In the northern hemisphere the air rotates anti-clockwise around low contour centres and clockwise around the high contour centres. In the southern hemisphere the air rotates clockwise around low contour centres and ...
Interval/period: N/A
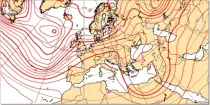
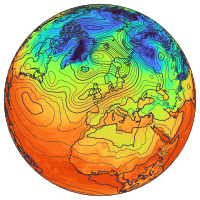
The air flow is not the same at all levels and can be very different in strength and direction when associated with vigorous weather systems...
Interval/period: N/A
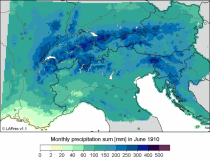
LAPrec1871 starts in 1871 and is based on data from 85 input series;
LAPrec1901 starts in 1901 and is based on data from 165 input series.
Interval/period: Sun, 01/01/1871 - Wed, 05/13/2026
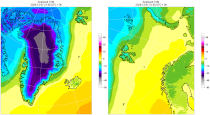
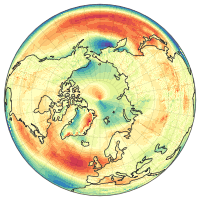
These charts show the difference between the latest HRES Long Window Data Analysis (LWDA) for the main synoptic hours of 00, 06, 12 and 18UTC, and its corresponding background field taken from the previous HRES LWDA run with the same validity time...
Interval/period: N/A
These daily and monthly data are pre-calculated and have the following types depending on the variables: daily and monthly averages, extremes and totals.
Interval/period: Sat, 09/01/1990 - Sat, 02/28/2026
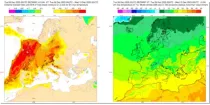
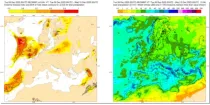
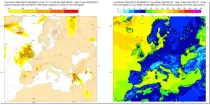
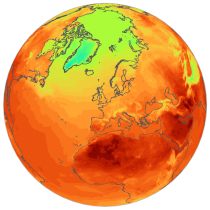
These charts show areas where anomalous 2 m maximum temperatures are likely to occur. These charts are based on the ECMWF ensem ...
Interval/period: N/A
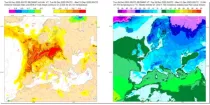
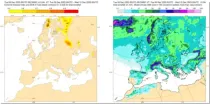
These charts show areas where anomalous 2 m minimum temperatures are likely to occur. These charts are based on the ECMWF ensem ...
Interval/period: N/A
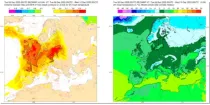
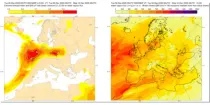
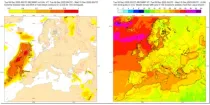
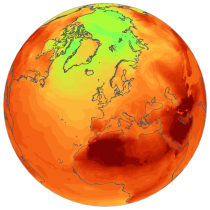
These charts show areas where anomalous 2 m temperatures are likely to occur. These charts are based on the ECMWF ensemble forecas ...
Interval/period: N/A
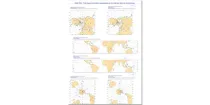
These charts aim to provide pointers to areas where anomalous precipitation amounts are likely to occur during the 24 hour, 2 day, 5 day or 10 day period previous to the selected validity time...
Interval/period: N/A
These charts show areas where anomalous snow fall is likely to occur. These charts are based on the ECMWF ensemble for ...
Interval/period: N/A
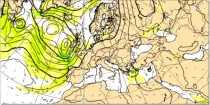
These charts aim to provide pointers to areas where anomalous values of water vapour flux are likely to occur based on the ECMWF en ...
Interval/period: N/A
These charts show areas where anomalous 10 m wind gusts are likely to occur. These charts are based on the ECMWF ensemble fore ...
Interval/period: N/A
These charts show areas where anomalous 10 m wind speeds are likely to occur. These charts are based on the ECMWF ensemble for ...
Interval/period: N/A
These charts show the mean and variation in the latest ECMWF ensemble forecast (ENS). ...
Interval/period: N/A
These charts show the mean and variation in the latest ECMWF ensemble forecast (ENS). ...
Interval/period: N/A

These charts show the mean and variation in the latest ECMWF ensemble forecast (ENS). ...
Interval/period: N/A
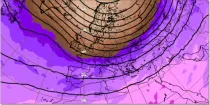
These charts show the mean and variation in the latest ECMWF ensemble forecast (ENS). ...
Interval/period: N/A
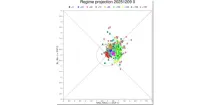
These diagrams aim to show the time evolution of regimes which are indicative of the likely weather in and around Europe.The winds across the Atlantic can usefully be classified into four regimes ...
Interval/period: N/A
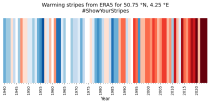
Data is available from 1940 onwards.
ERA5 replaces the ERA-Interim reanalysis.
Interval/period: Mon, 01/01/1940 - Sat, 05/02/2026
Data is available from 1940 onwards.
ERA5 replaces the ERA-Interim reanalysis.
Interval/period: Mon, 01/01/1940 - Sat, 05/02/2026
Data is available from 1940 onwards. ERA5 replaces the ERA-Interim reanalysis.
Interval/period: Mon, 01/01/1940 - Fri, 12/06/2024
Data is available from 1940 onwards.
ERA5 replaces the ERA-Interim reanalysis.
Interval/period: Mon, 01/01/1940 - Wed, 04/01/2026
Data is available from 1940 onwards.
ERA5 replaces the ERA-Interim reanalysis.
Interval/period: Mon, 01/01/1940 - Wed, 04/01/2026
Data is available from 1940 onwards.
ERA5 replaces the ERA-Interim reanalysis.
Interval/period: Mon, 01/01/1940 - Sat, 05/02/2026
Data is available from 1940 onwards.
ERA5 replaces the ERA-Interim reanalysis.
Interval/period: Mon, 01/01/1940 - Sat, 05/02/2026