Datasets

Various thermall comfort parameters showing thermal comfort
Interval/period: N/A
Interval/period: Mon, 01/01/1979 - Mon, 12/31/2018

The DestinE Digital Twin for Climate Change Adaptation (Climate DT) supports adaptation activities by providing innovative climate information on multi-decadal timescales, globally, at scales at which many impacts of climate change are observed. It combines cutting-edge global Earth-system models, impact-sector applications and observations into a unified framework to provide global climate projections and impact-sector information on multi-decadal timescales (1990 to ~2050), at very high spatial resolutions (5 to 10 km).
Interval/period: N/A
The nextGEMS data is aligned with the Climate Change Adaptation Digital Twin. The DestinE Digital Twin for Climate Change Adaptation (Climate DT) supports adaptation activities by providing innovative climate information on multi-decadal timescales, globally, at scales at which many impacts of climate change are observed.
Interval/period: N/A
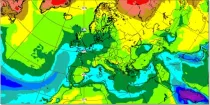
Specific humidity gives an indication of the amount of moisture within a sample of air (in g of water vapour within a kg of air, g kg⁻¹). The chart shows the specific humidity at 1000 hPa and 925 hPa levels and...
Interval/period: N/A