Datasets
Displaying 1 - 3 of 3

Various thermall comfort parameters showing thermal comfort
Interval/period: N/A
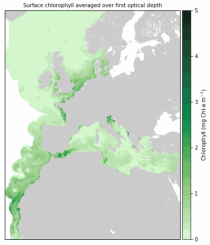
The dataset contains model projections of changes in marine physics and biogeochemistry and the lower trophic levels of the marine food web across the Northwest European Shelf and Mediterranean Sea out to the year 2100.
Interval/period: Mon, 01/01/1979 - Mon, 12/31/2018
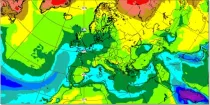
Specific humidity gives an indication of the amount of moisture within a sample of air (in g of water vapour within a kg of air, g kg⁻¹). The chart shows the specific humidity at 1000 hPa and 925 hPa levels and...
Interval/period: N/A