Datasets

Various thermall comfort parameters showing thermal comfort
Interval/period: N/A

Interval/period: Wed, 01/01/2003 - Wed, 12/03/2025
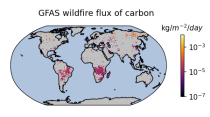
Emissions of atmospheric pollutants from biomass burning and vegetation fires are key drivers of the evolution of atmospheric composition, with a high degree of spatial and temporal variability, and an accurate representation of them in models is essential.
Interval/period: N/A
Interval/period: Sat, 01/01/2000 - Thu, 12/31/2020

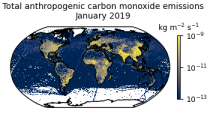
This data set contains gridded distributions of global anthropogenic and natural emissions.
Interval/period: N/A
Interval/period: Mon, 01/01/1979 - Tue, 12/31/2024

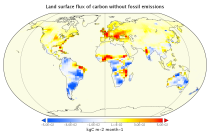
This data set contains net fluxes at the surface, atmospheric mixing ratios at model levels, and column-mean atmospheric mixing ratios for carbon dioxide (CO2), methane (CH4) and nitrous oxide (N20).
Interval/period: N/A

The nextGEMS data is aligned with the Climate Change Adaptation Digital Twin. The DestinE Digital Twin for Climate Change Adaptation (Climate DT) supports adaptation activities by providing innovative climate information on multi-decadal timescales, globally, at scales at which many impacts of climate change are observed.
Interval/period: N/A
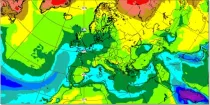
Specific humidity gives an indication of the amount of moisture within a sample of air (in g of water vapour within a kg of air, g kg⁻¹). The chart shows the specific humidity at 1000 hPa and 925 hPa levels and...
Interval/period: N/A