Datasets

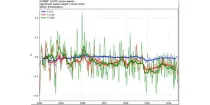
This chart provides information on the verification of forecasts of the number of tropical ...
Interval/period: N/A
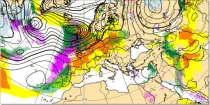
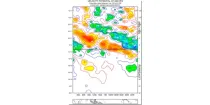
These charts aim to point towards areas where anomalous weather is likely to occur. ...
Interval/period: N/A
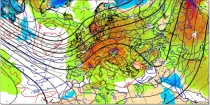
This chart shows 7-day mean anomalies for a range of parameters from the ECMWF Sub-seasonal ...
Interval/period: N/A

The nextGEMS data is aligned with the Climate Change Adaptation Digital Twin. The DestinE Digital Twin for Climate Change Adaptation (Climate DT) supports adaptation activities by providing innovative climate information on multi-decadal timescales, globally, at scales at which many impacts of climate change are observed.
Interval/period: N/A
These diagrams show verification scores for significant wave height and 10 m wind for three ...
Interval/period: N/A
Sunshine for any point is assessed using the model representation of cloud layers to decide how much direct solar (shortwave) radiation reaches the Earth's surface...
Interval/period: N/A
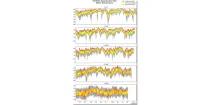
These diagrams compare scores of ensemble control (red) and ensemble members (central 50% of ...
Interval/period: N/A
The time-longitude diagram (Hovmoller diagram) shows a section of ensemble mean anomalies or ...
Interval/period: N/A
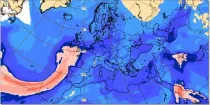
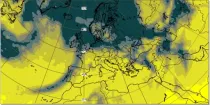
The charts show the forecast value of the vertically integrated total column water (vapour + cloud water + cloud ice but with no precipitation included) in units of kg m⁻²...
Interval/period: N/A