
Datasets
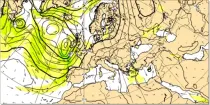
The air flow is not the same at all levels and can be very different in strength and direction when associated with vigorous weather systems...
Interval/period: N/A
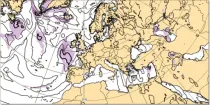
AIFS ENS: a deep learning-based system developed by ECMWF. It is initialised with ECMWF perturbed forecasts and operates at N320 (~0.25Deg) resolution
Interval/period: N/A
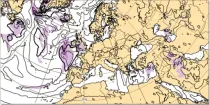
AIFS ENS: a deep learning-based system developed by ECMWF. It is initialised with ECMWF perturbed forecasts and operates at N320 (~0.25Deg) resolution
Interval/period: N/A
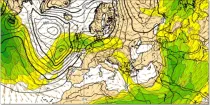
Wind speed at 200 hPa highlights the jet stream (areas of strong winds in the upper troposphere) which can help identify movement and development of depressions...
Interval/period: N/A
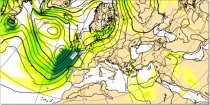
Wind speeds near the surface are roughly proportional to the distance between isobars so closely packed isobars mean strong surface winds...
Interval/period: N/A
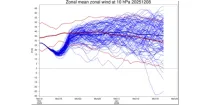
This shows the daily distribution and evolution of mean zonal wind at 10hPa at 60N or 60S. ...
Interval/period: N/A
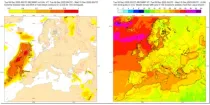
These charts show areas where anomalous 10 m wind gusts are likely to occur. These charts are based on the ECMWF ensemble fore ...
Interval/period: N/A
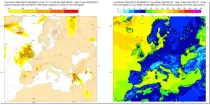
These charts show areas where anomalous 10 m wind speeds are likely to occur. These charts are based on the ECMWF ensemble for ...
Interval/period: N/A
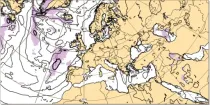
Spread usually, but not always, increases with forecast range. Spread refers to the uncertainty of the values of a parameter but it does not necessarily refer to the flow patterns...
Interval/period: N/A
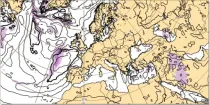
The ensemble mean is the mean value derived from all the 50 ensemble members plus the control member. This value attempts to capture the general picture while smoothing out spurious detail...
Interval/period: N/A
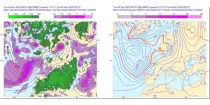
These charts show the mean and variation in the latest ECMWF ensemble forecast (ENS). ...
Interval/period: N/A
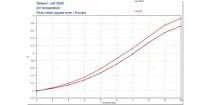
Scores of forecasts of surface parameters by experimental machine learning models
Interval/period: N/A
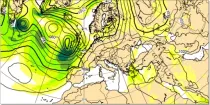
Maximum Wind gusts at 10 m above the earth's surface during the 6 hour period previous to the selected validity time are shown using colour shading. 10 m wind gusts are a post-processed product...
Interval/period: N/A
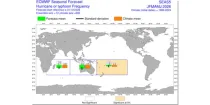
The ECMWF seasonal forecasts (SEAS5) are produced every month with a 51-member ensemble at a ...
Interval/period: N/A
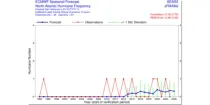
This chart provides information on the verification of forecasts of the number of tropical ...
Interval/period: N/A
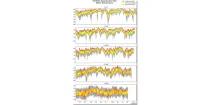
These diagrams compare scores of ensemble control (red) and ensemble members (central 50% of ...
Interval/period: N/A
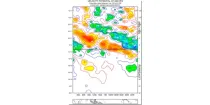
The time-longitude diagram (Hovmoller diagram) shows a section of ensemble mean anomalies or ...
Interval/period: N/A
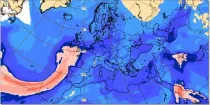
The charts show the forecast value of the vertically integrated total column water (vapour + cloud water + cloud ice but with no precipitation included) in units of kg m⁻²...
Interval/period: N/A
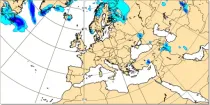
Forecast precipitation is considered to be snow if the model atmosphere above and at the ground surface is forecast to be below 0°C. Where the ground surface lies near the 0°C level...
Interval/period: N/A
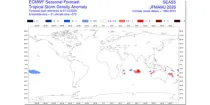
The ECMWF seasonal forecasts (SEAS5) are produced every month with a 51-member ensemble at a ...
Interval/period: N/A
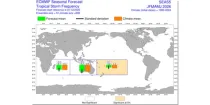
The ECMWF seasonal forecasts (SEAS5) are produced every month with a 51-member ensemble at a ...
Interval/period: N/A
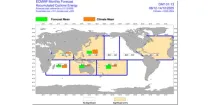
The charts show mean frequency and accumulated cyclone energy of tropical storm activity. ...
Interval/period: N/A
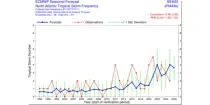
This chart provides information on the verification of forecasts of the expected number of ...
Interval/period: N/A
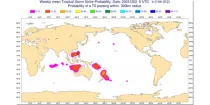
The charts show the evolution of existing and potential tropical cyclone activity. ...
Interval/period: N/A
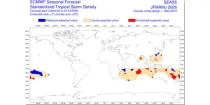
The ECMWF seasonal forecasts (SEAS5) are produced every month with a 51-member ensemble at a ...
Interval/period: N/A