
Datasets
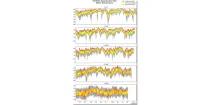
These diagrams compare scores of ensemble control (red) and ensemble members (central 50% of ...
Interval/period: N/A
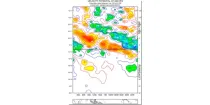
The time-longitude diagram (Hovmoller diagram) shows a section of ensemble mean anomalies or ...
Interval/period: N/A
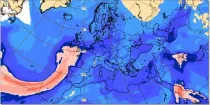
The charts show the forecast value of the vertically integrated total column water (vapour + cloud water + cloud ice but with no precipitation included) in units of kg m⁻²...
Interval/period: N/A
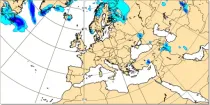
Forecast precipitation is considered to be snow if the model atmosphere above and at the ground surface is forecast to be below 0°C. Where the ground surface lies near the 0°C level...
Interval/period: N/A
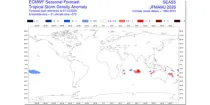
The ECMWF seasonal forecasts (SEAS5) are produced every month with a 51-member ensemble at a ...
Interval/period: N/A
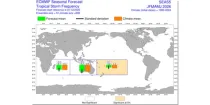
The ECMWF seasonal forecasts (SEAS5) are produced every month with a 51-member ensemble at a ...
Interval/period: N/A
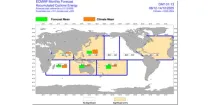
The charts show mean frequency and accumulated cyclone energy of tropical storm activity. ...
Interval/period: N/A
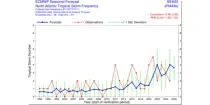
This chart provides information on the verification of forecasts of the expected number of ...
Interval/period: N/A
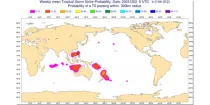
The charts show the evolution of existing and potential tropical cyclone activity. ...
Interval/period: N/A
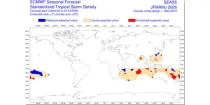
The ECMWF seasonal forecasts (SEAS5) are produced every month with a 51-member ensemble at a ...
Interval/period: N/A
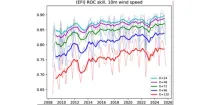
This diagram shows the variation of Relative Operating Characteristics (ROC) scores with various ...
Interval/period: N/A
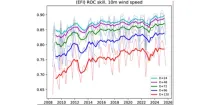
This diagram gives a measure of the effectiveness of the model. The drop-down menu can ...
Interval/period: N/A
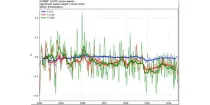
These diagrams show verification scores for significant wave height and 10 m wind for three ...
Interval/period: N/A
Potential vorticity (PV) helps description and understanding of dynamic processes in the atmosphere by giving an indication of ascending or descending air flows and the development or weakening of ...
Interval/period: N/A
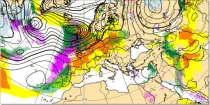
These charts aim to point towards areas where anomalous weather is likely to occur. ...
Interval/period: N/A
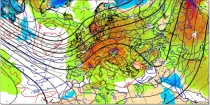
This chart shows 7-day mean anomalies for a range of parameters from the ECMWF Sub-seasonal ...
Interval/period: N/A
Note: This Generation 1 Collection has been superseded by Generation 2 Simulation-level Collections
Interval/period: N/A
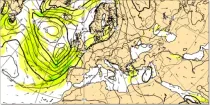
GraphCast (Google DeepMind): a deep learning-based system developed by Google DeepMind.It is initialised with ECMWF analysis. GraphCast operates at 0.25° resolution.
Interval/period: N/A
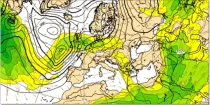
Pangu-Weather: a deep learning-based system developed by Huawei. It is initialised with ECMWF analysis. Pangu-Weather operates at 0.25° resolution.
Interval/period: N/A
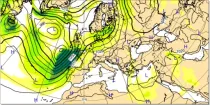
Pangu-Weather: a deep learning-based system developed by Huawei. It is initialised with ECMWF analysis. Pangu-Weather operates at 0.25° resolution.
Interval/period: N/A
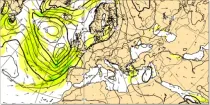
Pangu-Weather: a deep learning-based system developed by Huawei. It is initialised with ECMWF analysis. Pangu-Weather operates at 0.25° resolution.
Interval/period: N/A
The nextGEMS data is aligned with the Climate Change Adaptation Digital Twin. The DestinE Digital Twin for Climate Change Adaptation (Climate DT) supports adaptation activities by providing innovative climate information on multi-decadal timescales, globally, at scales at which many impacts of climate change are observed.
Interval/period: N/A
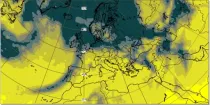
Sunshine for any point is assessed using the model representation of cloud layers to decide how much direct solar (shortwave) radiation reaches the Earth's surface...
Interval/period: N/A
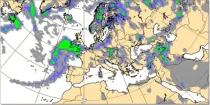
Predicting near surface visibility is dependent on predicting the correct dynamic and thermodynamic conditions in the boundary layer which can be highly variable. Fog is an extremely important weather hazard...
Interval/period: N/A
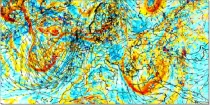
The movement or transfer of vorticity helps in the assessment of vertical motion of air (ascent) in the troposphere. Where a local vorticity maximum approaches an area there is a tendency for air to rise and where a local vorticity maximum moves ...
Interval/period: N/A