Datasets

These charts show the mean and variation in the latest ECMWF ensemble forecast (ENS). ...
Interval/period: N/A
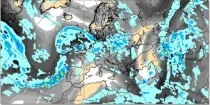
The CAT (Clear Air Turbulence) parameter is given in units of the turbulent Eddy Dissipation Rate (EDR), product shows EDR values on selected flight levels overlayed with wind speeds.
Interval/period: N/A
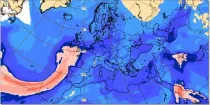
This chart shows the probability that both the wind at 10 m above the earth's surface is ...
Interval/period: N/A
This chart shows the probability that both the wind at 10 m above the earth's surface is ...
Interval/period: N/A

This chart shows the probability that both the wind at 10 m above the earth's surface is ...
Interval/period: N/A
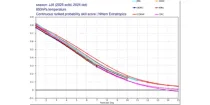
These diagrams compare Continuous Ranked Probability Skill Scores (CRPSS) of ECMWF with ...
Interval/period: N/A
Sunshine for any point is assessed using the model representation of cloud layers to decide how much direct solar (shortwave) radiation reaches the Earth's surface...
Interval/period: N/A
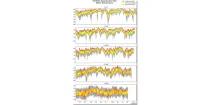
These diagrams compare scores of ensemble control (red) and ensemble members (central 50% of ...
Interval/period: N/A
The time-longitude diagram (Hovmoller diagram) shows a section of ensemble mean anomalies or ...
Interval/period: N/A
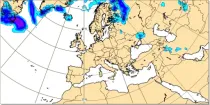
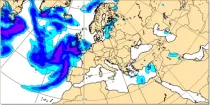
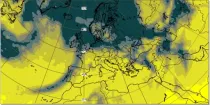
The charts show the forecast value of the vertically integrated total column water (vapour + cloud water + cloud ice but with no precipitation included) in units of kg m⁻²...
Interval/period: N/A
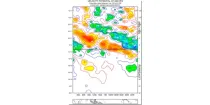
Divergence of horizontal air flow or winds is a measure of the spreading out of air at a particular point. Divergence is +ve where air spreads out; –ve where air converges...
Interval/period: N/A

The ECMWF seasonal forecasts (SEAS5) are produced every month with a 51-member ensemble at a ...
Interval/period: N/A

This chart provides information on the verification of forecasts of the number of tropical ...
Interval/period: N/A