Datasets

This chart provides information on the verification of forecasts of Accumulated Cyclone Energy ...
Interval/period: N/A

The ECMWF seasonal forecasts (SEAS5) are produced every month with a 51-member ensemble at a ...
Interval/period: N/A
Interval/period: Mon, 01/01/1951 - Sun, 07/05/2026
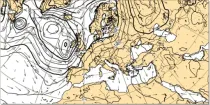
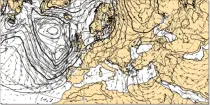
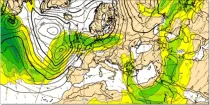
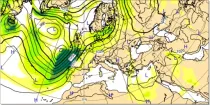
These charts show surface pressure patterns. Areas of high pressure (anticyclones) are usually associated with settled weather...
Interval/period: N/A

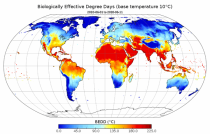
Various thermall comfort parameters showing thermal comfort
Interval/period: N/A
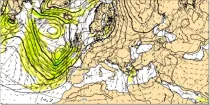
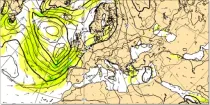
Bulk Wind Shearcharts show the vector value (in wind arrow form) of the shear between the low level, near surface level (10 m) and a mid-tropospheric level (about 6 km)...
Interval/period: N/A
The surface wind is influenced by the roughness of the earth's surface and is likely to be less strong, and a little backed (in the northern hemisphere) or veered (in the southern hemisphere)...
Interval/period: N/A
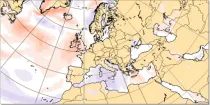
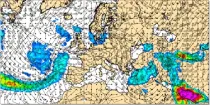
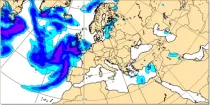
This chart shows the anomaly in the wind speed at 10 m above the earth's surface (in m/s) ...
Interval/period: N/A
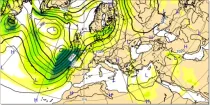
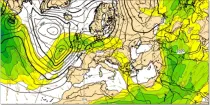
These charts show surface pressure patterns. Areas of high pressure (anticyclones) are usually associated with settled weather...
Interval/period: N/A
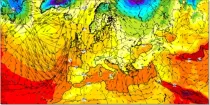
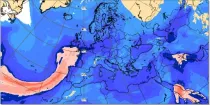
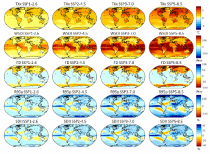
Air temperatures at 2 m above the earth's surface approximate most closely to the conditions a person would most likely experience...
Interval/period: N/A

Aurora: a deep learning-based system developed by Microsoft. It is initialised with ECMWF analysis. Aurora operates at 0.1° resolution.
Interval/period: N/A

Aurora: a deep learning-based system developed by Microsoft. It is initialised with ECMWF analysis. Aurora operates at 0.1° resolution.
Interval/period: N/A
Aurora: a deep learning-based system developed by Microsoft. It is initialised with ECMWF analysis. Aurora operates at 0.1° resolution.
Interval/period: N/A
FourCastNet v2-small:a deep learning-based system developed by NVIDIA in collaboration with researchers at several US universities.It is initialised with ECMWF analysis. FourCastNet operates at 0.25° resolution.
Interval/period: N/A
FourCastNet v2-small:a deep learning-based system developed by NVIDIA in collaboration with researchers at several US universities.It is initialised with ECMWF analysis. FourCastNet operates at 0.25° resolution.
Interval/period: N/A
FourCastNet v2-small:a deep learning-based system developed by NVIDIA in collaboration with researchers at several US universities.It is initialised with ECMWF analysis. FourCastNet operates at 0.25° resolution.
Interval/period: N/A

FourCastNet v2-small:a deep learning-based system developed by NVIDIA in collaboration with researchers at several US universities.It is initialised with ECMWF analysis. FourCastNet operates at 0.25° resolution.
Interval/period: N/A
GraphCast (Google DeepMind): a deep learning-based system developed by Google DeepMind.It is initialised with ECMWF analysis. GraphCast operates at 0.25° resolution.
Interval/period: N/A
GraphCast (Google DeepMind): a deep learning-based system developed by Google DeepMind.It is initialised with ECMWF analysis. GraphCast operates at 0.25° resolution.
Interval/period: N/A
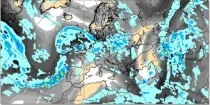
The CAT (Clear Air Turbulence) parameter is given in units of the turbulent Eddy Dissipation Rate (EDR), product shows EDR values on selected flight levels overlayed with wind speeds.
Interval/period: N/A
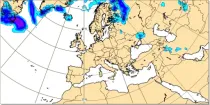
This chart shows the probability that both the wind at 10 m above the earth's surface is ...
Interval/period: N/A
This chart shows the probability that both the wind at 10 m above the earth's surface is ...
Interval/period: N/A

This chart shows the probability that both the wind at 10 m above the earth's surface is ...
Interval/period: N/A
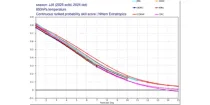
These diagrams compare Continuous Ranked Probability Skill Scores (CRPSS) of ECMWF with ...
Interval/period: N/A
Interval/period: N/A