Datasets
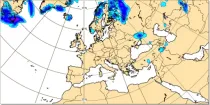
This chart shows probability information regarding freezing rain derived from the ECMWF ensemble ...
Interval/period: N/A

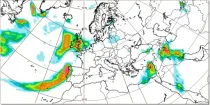
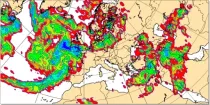
This chart shows probability information regarding lightning flash density derived from the ...
Interval/period: N/A
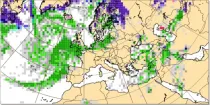
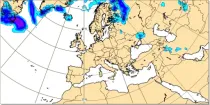
This chart shows probability information regarding precipitation type at the validity time ...
Interval/period: N/A
These charts show probabilities of multi-day precipitation accumulation. ...
Interval/period: N/A
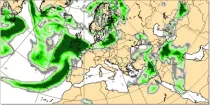
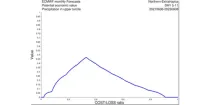
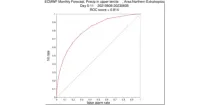
This chart shows probability information regarding point precipitation, as derived from the ...
Interval/period: N/A
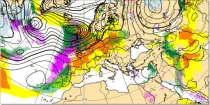
This chart shows probability information derived from the ECMWF ensemble (ENS) regarding large ...
Interval/period: N/A
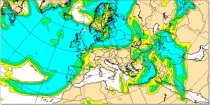
This chart shows probability information derived from the ECMWF ensemble (ENS) regarding the ...
Interval/period: N/A
This chart shows probability information regarding total precipitation derived from the ECMWF ...
Interval/period: N/A

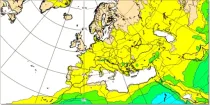
This chart shows probability information regarding visibility near the surface derived from the ...
Interval/period: N/A
This chart shows probability information regarding 24 hour total precipitation derived from the ...
Interval/period: N/A
**Note:** In **June 2023** ECMWF implemented a **major upgrade ...**
Interval/period: N/A
**Note:** In **June 2023** ECMWF implemented a **major upgrade ...**
Interval/period: N/A
**Note:** In **June 2023** ECMWF implemented a **major upgrade ...**
Interval/period: N/A
Precipitation totals include all precipitation types (rain, snow etc.) (in mm of rainfall or rainfall equivalent) falling in 6 hour or 12 hour periods using colour shading...
Interval/period: N/A
**Note:** In **June 2023** ECMWF implemented a **major upgrade ...**
Interval/period: N/A
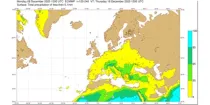
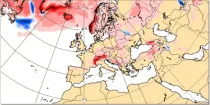
This chart shows the anomaly in precipitation (in mm of rainfall or rainfall equivalent) during a 24 hour period immediately prior to the chosen valid date/time...
Interval/period: N/A
This chart shows the anomaly in snowfall (in mm of rainfall equivalent) during a 24 hour period immediately prior to the chosen valid date/time...
Interval/period: N/A

The charts show mean frequency and accumulated cyclone energy of tropical storm activity. ...
Interval/period: N/A

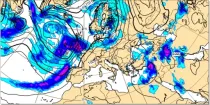
The charts show the evolution of existing and potential tropical cyclone activity. ...
Interval/period: N/A
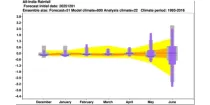
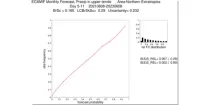
The ECMWF seasonal forecasts (SEAS5) are produced every month with a 51-member ensemble at ...
Interval/period: N/A
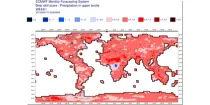
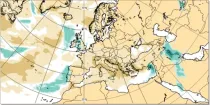
These charts aim to point towards areas where anomalous weather is likely to occur. ...
Interval/period: N/A
Precipitation totals include all precipitation types (rain, snow etc.) (in mm of rainfall or rainfall equivalent) falling in 6 hour or 12 hour periods using colour shading...
Interval/period: N/A
Total accumulated rainfall charts identify areas at greater risk of significant rainfall (or rain equivalent e.g.snowfall) but give no information regarding whether this occurs over a short or prolonged time period...
Interval/period: N/A
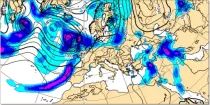
This chart shows the probability that the temperature at 2 m above the earth’s surface is below 0°C and the total of convective and broad scale precipitation ...
Interval/period: N/A
This chart shows the probability that both the wind at 10 m above the earth's surface is ...
Interval/period: N/A