Datasets
This product shows ENS meteograms from next model version of IFS cycle 50R1 that is planned to be ...
Interval/period: N/A
**This product shows ENS meteograms from next model version of IFS cycle 50R1 that is planned ...**
Interval/period: N/A
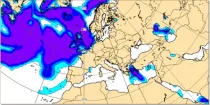
**Next IFS version (cycle 50r1)**. This product shows the probability of visibility (%) in 2 ...
Interval/period: N/A
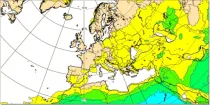
(Next IFS version - CY50R1) Probability of precipitation type (%) in precipitation rate categories ...
Interval/period: N/A
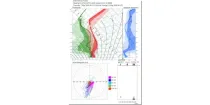
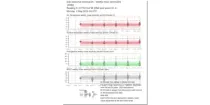
(New IFS cycle 50R1) The Vertical Profiles display the vertical structure of the forecast model atmosphere in a familiar user friendly way. The vertical structure of temperatures (red) dewpoints (green) and dewpoint depressions (blue) from each ENS member ...
Interval/period: N/A
b'Detailed information on these EXPERIMENTAL products can be found
Interval/period: N/A

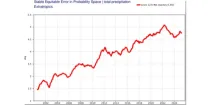
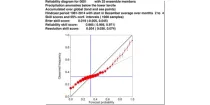
This diagram gives a measure of the effectiveness of the model by showing how far ahead in the ...
Interval/period: N/A
This diagram gives a measure of the effectiveness of the model by showing when the 1-SEEPS of ...
Interval/period: N/A

This diagram gives a measure of the effectiveness of the model by showing when the 1-SEEPS of ...
Interval/period: N/A
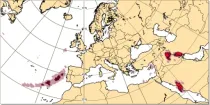
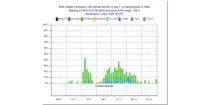
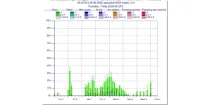
Lightning flash densities are diagnosed from forecast values of hydrometeor content, CAPE (convective available potential energy), and cloud base height that has been output by the convection scheme...
Interval/period: N/A
**Note:** In **June 2023** ECMWF implemented a **major upgrade ...**
Interval/period: N/A
GraphCast (Google DeepMind): a deep learning-based system developed by Google DeepMind.It is initialised with ECMWF analysis. GraphCast operates at 0.25° resolution.
Interval/period: N/A

GraphCast (Google DeepMind): a deep learning-based system developed by Google DeepMind.It is initialised with ECMWF analysis. GraphCast operates at 0.25° resolution.
Interval/period: N/A
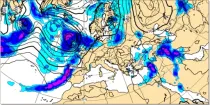
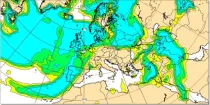
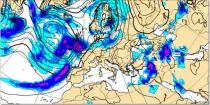
Precipitation totals include all precipitation types (rain, snow etc.) (in mm of rainfall or rainfall equivalent) falling in 6 hour or 12 hour periods using colour shading...
Interval/period: N/A
Total accumulated rainfall charts identify areas at greater risk of significant rainfall (or rain equivalent e.g.snowfall) but give no information regarding whether this occurs over a short or prolonged time period...
Interval/period: N/A
AIFS ENS: a deep learning-based system developed by ECMWF. It is initialised with ECMWF perturbed forecasts and operates at N320 (~0.25Deg) resolution
Interval/period: N/A
AIFS ENS: a deep learning-based system developed by ECMWF. It is initialised with ECMWF perturbed forecasts and operates at N320 (~0.25Deg) resolution
Interval/period: N/A
AIFS ENS: a deep learning-based system developed by ECMWF. It is initialised with ECMWF perturbed forecasts and operates at N320 (~0.25Deg) resolution
Interval/period: N/A
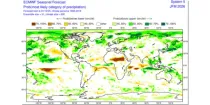
The reliability diagram shows the reliability of the ECMWF seasonal forecast system (SEAS5) with ...
Interval/period: N/A
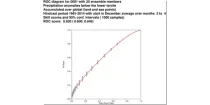
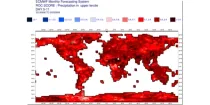
This chart shows the Relative Operating Characteristics (ROC) diagram for the three-month ...
Interval/period: N/A
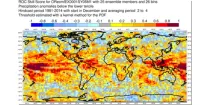
This chart shows the spatial variation in the Relative Operating Characteristics (ROC) skill ...
Interval/period: N/A
The ECMWF seasonal forecasts (SEAS5) are produced every month with a 51-member ensemble at a ...
Interval/period: N/A
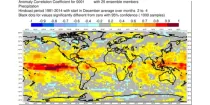
This chart shows the spatial variation in the Anomaly Correlation Coefficient (ACC) for the ...
Interval/period: N/A
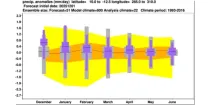
The ECMWF seasonal forecasts (SEAS5) are produced every month with a 51-member ensemble at ...
Interval/period: N/A
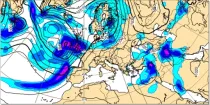
The charts show totals of large scale precipitation, convective precipitation, and the total of precipitation during the 6 hour period previous to the selected validity time...
Interval/period: N/A