b'Detailed information on these EXPERIMENTAL products can be found

calendar_today Interval/period: N/A

open_in_newview in Open Charts

This diagram gives a measure of the effectiveness of the model by showing how far ahead in the ...

calendar_today Interval/period: N/A

open_in_newview in Open Charts

This diagram gives a measure of the effectiveness of the model by showing when the 1-SEEPS of ...

calendar_today Interval/period: N/A

open_in_newview in Open Charts

This diagram gives a measure of the effectiveness of the model by showing when the 1-SEEPS of ...

calendar_today Interval/period: N/A

open_in_newview in Open Charts

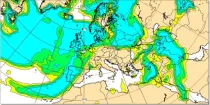
Lightning flash densities are diagnosed from forecast values of hydrometeor content, CAPE (convective available potential energy), and cloud base height that has been output by the convection scheme...

calendar_today Interval/period: N/A

open_in_newview in Open Charts

**Note:** In **June 2023** ECMWF implemented a **major upgrade ...**

calendar_today Interval/period: N/A

open_in_newview in Open Charts
This dataset provides daily gridded data of sea ice concentration for both hemispheres derived from satellite passive microwave brightness temperatures. Sea ice is an important component of our climate system and a sensitive indicator of climate change. Its presence or its retreat has a strong impact on air-sea interactions, the Earth’s energy budget as well as marine ecosystems. It is recognised by the Global Climate Observing System as an Essential Climate Variable.

calendar_today Interval/period: Sun, 10/01/1978 - Mon, 09/29/2025

This dataset provides daily gridded fields of sea ice drift vectors for both hemispheres derived from satellite passive microwave brightness temperatures and atmospheric reanalysis data. Sea ice is an important component of our climate system and a sensitive indicator of climate change. Its presence or retreat significantly affects ocean-atmosphere interactions, the Earth’s energy budget as well as marine ecosystems. It is classified as an Essential Climate Variable by the Global Climate Observing System.

calendar_today Interval/period: Tue, 01/01/1991 - Thu, 12/31/2020

This dataset provides daily gridded data of sea ice edge and sea ice type derived from brightness temperatures measured by satellite passive microwave radiometers. Sea ice is an important component of our climate system and a sensitive indicator of climate change. Its presence or its retreat has a strong impact on air-sea interactions, the Earth’s energy budget as well as marine ecosystems. It is recognized by the Global Climate Observing System as an Essential Climate Variable. Sea ice edge and type are some of the parameters used to characterise sea ice.

calendar_today Interval/period: Wed, 10/25/1978 - Wed, 09/24/2025

This dataset provides daily and monthly sea ice surface temperature (IST) fields over the polar oceans from 1982 to the present. The data are derived from thermal infrared measurements from a single satellite sensor type: the Advanced Very High Resolution Radiometer (AVHRR) onboard National Oceanic and Atmospheric Administration (NOAA) and Meteorological Operational (MetOp) satellites.

calendar_today Interval/period: Mon, 01/01/1979 - Tue, 09/30/2025

This dataset provides gridded sea ice thickness data for the Arctic, derived from satellite observations. Sea ice plays a vital role in the climate system, influencing air-sea interactions, the Earth’s energy balance, and marine ecosystems. It is recognised by the Global Climate Observing System (GCOS) as an Essential Climate Variable (ECV). Sea ice thickness is a key characteristic used alongside other parameters such as concentration, edge, and type, all available in the Climate Data Store (CDS).

calendar_today Interval/period: Tue, 10/01/2002 - Sat, 04/12/2025

This dataset provides gridded daily and monthly mean global estimates of sea level anomaly based on satellite altimetry measurements. The rise in global mean sea level in recent decades has been one of the most important and well-known consequences of climate warming, putting a large fraction of the world population and economic infrastructure at greater risk of flooding. However, changes in the global average sea level mask regional variations that can be one order of magnitude larger.

calendar_today Interval/period: Fri, 01/01/1993 - Sun, 12/31/2023

This dataset provides global daily sea surface temperature (SST) data from the Group for High Resolution Sea Surface Temperature (GHRSST) multi-product ensemble (GMPE) produced by the European Space Agency SST Climate Change Initiative (ESA SST CCI). The GMPE system was designed to allow users to compare the outputs from different SST analysis systems and understand their similarities and differences. Although originally intended for comparison of near real time data, it has also been used to compare long historical datasets.

calendar_today Interval/period: Tue, 09/01/1981 - Sat, 12/31/2016

The Essential Climate Variables for assessment of climate variability from 1979 to present dataset contains a selection of climatologies, monthly anomalies and monthly mean fields of Essential Climate Variables (ECVs) suitable for monitoring and assessment of climate variability and change. Selection criteria are based on accuracy and temporal consistency on monthly to decadal time scales.

calendar_today Interval/period: Mon, 01/01/1979 - Wed, 04/01/2026

GraphCast (Google DeepMind): a deep learning-based system developed by Google DeepMind.It is initialised with ECMWF analysis. GraphCast operates at 0.25° resolution.

calendar_today Interval/period: N/A

open_in_newview in Open Charts

GraphCast (Google DeepMind): a deep learning-based system developed by Google DeepMind.It is initialised with ECMWF analysis. GraphCast operates at 0.25° resolution.

calendar_today Interval/period: N/A

open_in_newview in Open Charts

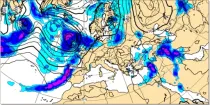
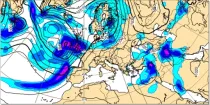
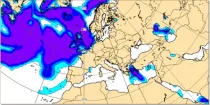
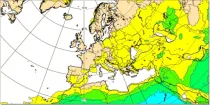
Precipitation totals include all precipitation types (rain, snow etc.) (in mm of rainfall or rainfall equivalent) falling in 6 hour or 12 hour periods using colour shading...

calendar_today Interval/period: N/A

open_in_newview in Open Charts

Total accumulated rainfall charts identify areas at greater risk of significant rainfall (or rain equivalent e.g.snowfall) but give no information regarding whether this occurs over a short or prolonged time period...

calendar_today Interval/period: N/A

open_in_newview in Open Charts

AIFS ENS: a deep learning-based system developed by ECMWF. It is initialised with ECMWF perturbed forecasts and operates at N320 (~0.25Deg) resolution

calendar_today Interval/period: N/A

open_in_newview in Open Charts

AIFS ENS: a deep learning-based system developed by ECMWF. It is initialised with ECMWF perturbed forecasts and operates at N320 (~0.25Deg) resolution

calendar_today Interval/period: N/A

open_in_newview in Open Charts

AIFS ENS: a deep learning-based system developed by ECMWF. It is initialised with ECMWF perturbed forecasts and operates at N320 (~0.25Deg) resolution

calendar_today Interval/period: N/A

open_in_newview in Open Charts

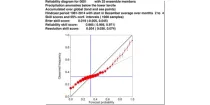
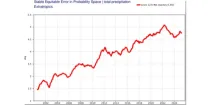
The reliability diagram shows the reliability of the ECMWF seasonal forecast system (SEAS5) with ...

calendar_today Interval/period: N/A

open_in_newview in Open Charts

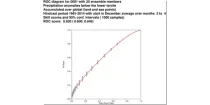
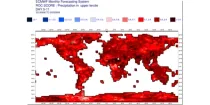
This chart shows the Relative Operating Characteristics (ROC) diagram for the three-month ...

calendar_today Interval/period: N/A

open_in_newview in Open Charts

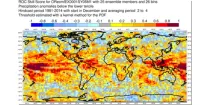
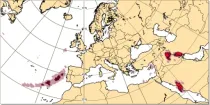
This chart shows the spatial variation in the Relative Operating Characteristics (ROC) skill ...

calendar_today Interval/period: N/A

open_in_newview in Open Charts

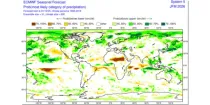
The ECMWF seasonal forecasts (SEAS5) are produced every month with a 51-member ensemble at a ...

calendar_today Interval/period: N/A

open_in_newview in Open Charts