Datasets
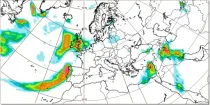
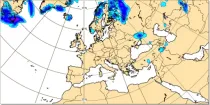
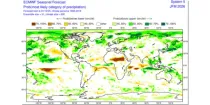
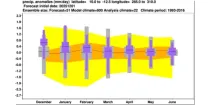
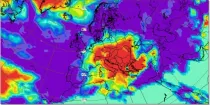
This chart shows probability information regarding point precipitation, as derived from the ...
Interval/period: N/A
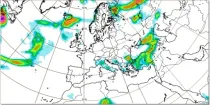
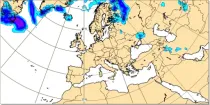
This chart shows probability information regarding point precipitation, as derived from the ...
Interval/period: N/A
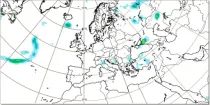
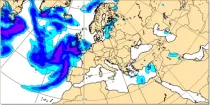
This chart shows probability information regarding point precipitation, as derived from the ...
Interval/period: N/A
b'Detailed information on these EXPERIMENTAL products can be found
Interval/period: N/A
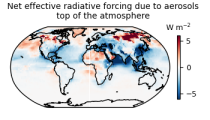
This dataset provides geographical distributions of the radiative forcing (RF) by key atmospheric constituents. The radiative forcing estimates are based on the CAMS reanalysis and additional model simulations and are provided separately for...
- carbon dioxide
- methane
- tropospheric ozone
- stratospheric ozone
- interactions between anthropogenic aerosols and radiation
Interval/period: N/A
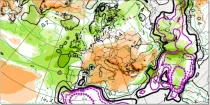
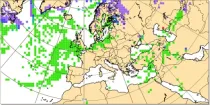
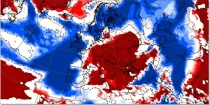
This chart shows the probability that the temperature at 2 m above the earth’s surface is below 0°C and the total of convective and broad scale precipitation ...
Interval/period: N/A
This chart shows the probability that both the wind at 10 m above the earth's surface is ...
Interval/period: N/A
This chart shows the probability that both the wind at 10 m above the earth's surface is ...
Interval/period: N/A
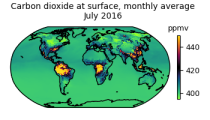
This dataset is part of the ECMWF Atmospheric Composition Reanalysis focusing on long-lived greenhouse gases: carbon dioxide (CO2) and methane (CH4). The emissions and natural fluxes at the surface are crucial for the evolution of the long-lived greenhouse gases in the atmosphere. In this dataset the CO2 fluxes from terrestrial vegetation are modelled in order to simulate the variability across a wide range of scales from diurnal to inter-annual.
Interval/period: N/A
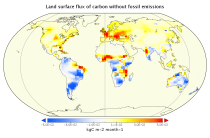
This dataset is part of the ECMWF Atmospheric Composition Reanalysis focusing on long-lived greenhouse gases: carbon dioxide (CO2) and methane (CH4). The emissions and natural fluxes at the surface are crucial for the evolution of the long-lived greenhouse gases in the atmosphere. In this dataset the CO2 fluxes from terrestrial vegetation are modelled in order to simulate the variability across a wide range of scales from diurnal to inter-annual.
Interval/period: N/A
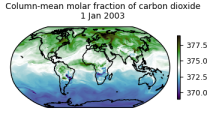
This data set contains net fluxes at the surface, atmospheric mixing ratios at model levels, and column-mean atmospheric mixing ratios for carbon dioxide (CO2), methane (CH4) and nitrous oxide (N20).
Interval/period: N/A
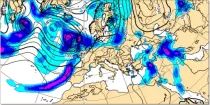
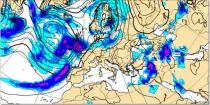
Precipitation totals include all precipitation types (rain, snow etc.) (in mm of rainfall or rainfall equivalent) falling in 6 hour or 12 hour periods using colour shading...
Interval/period: N/A
Total accumulated rainfall charts identify areas at greater risk of significant rainfall (or rain equivalent e.g.snowfall) but give no information regarding whether this occurs over a short or prolonged time period...
Interval/period: N/A
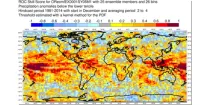
This chart shows the spatial variation in the Relative Operating Characteristics (ROC) skill ...
Interval/period: N/A
The ECMWF seasonal forecasts (SEAS5) are produced every month with a 51-member ensemble at a ...
Interval/period: N/A
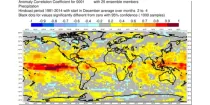
This chart shows the spatial variation in the Anomaly Correlation Coefficient (ACC) for the ...
Interval/period: N/A
The ECMWF seasonal forecasts (SEAS5) are produced every month with a 51-member ensemble at ...
Interval/period: N/A
The charts show totals of large scale precipitation, convective precipitation, and the total of precipitation during the 6 hour period previous to the selected validity time...
Interval/period: N/A
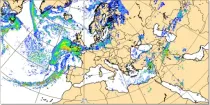
These charts show the rate of fall of large scale precipitation, the rate of fall of convective precipitation, the rate of fall of snowfall, or the rate of fall of all precipitation...
Interval/period: N/A
Where precipitation is forecast, a type of precipitation can be assigned according to the temperature structure of the model atmosphere that includes the layers through which the model precipitation falls...
Interval/period: N/A
This chart shows probabilities for the 7-day mean anomalies of precipitation to be in defined ...
Interval/period: N/A
This chart shows probabilities that 7-day-total precipitation (from the 101 forecast members) ...
Interval/period: N/A
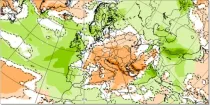
This chart shows 7-day mean anomalies of precipitation accumulation amounts from the ECMWF ...
Interval/period: N/A
This chart shows probability information regarding freezing rain derived from the ECMWF ensemble ...
Interval/period: N/A

This chart shows probability information regarding lightning flash density derived from the ...
Interval/period: N/A