
Datasets
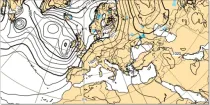
Where precipitation is forecast, a type of precipitation can be assigned according to the temperature structure of the model atmosphere that includes the layers through which the model precipitation falls...
Interval/period: N/A
Total accumulated rainfall charts identify areas at greater risk of significant rainfall (or rain equivalent e.g.snowfall) but give no information regarding whether this occurs over a short or prolonged time period...
Interval/period: N/A
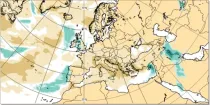
This chart shows the anomaly in precipitation (in mm of rainfall or rainfall equivalent) during a 24 hour period immediately prior to the chosen valid date/time...
Interval/period: N/A
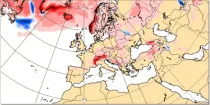
This chart shows the anomaly in snowfall (in mm of rainfall equivalent) during a 24 hour period immediately prior to the chosen valid date/time...
Interval/period: N/A
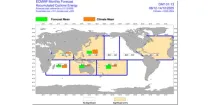
The charts show mean frequency and accumulated cyclone energy of tropical storm activity. ...
Interval/period: N/A
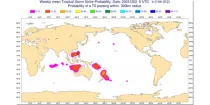
The charts show the evolution of existing and potential tropical cyclone activity. ...
Interval/period: N/A
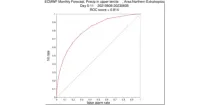
**Note:** In **June 2023** ECMWF implemented a **major upgrade ...**
Interval/period: N/A
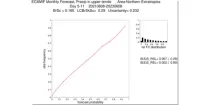
**Note:** In **June 2023** ECMWF implemented a **major upgrade ...**
Interval/period: N/A
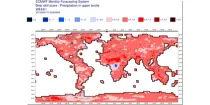
**Note:** In **June 2023** ECMWF implemented a **major upgrade ...**
Interval/period: N/A
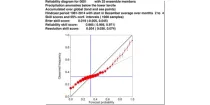
The reliability diagram shows the reliability of the ECMWF seasonal forecast system (SEAS5) with ...
Interval/period: N/A
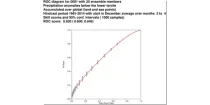
This chart shows the Relative Operating Characteristics (ROC) diagram for the three-month ...
Interval/period: N/A
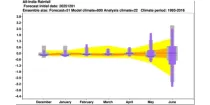
The ECMWF seasonal forecasts (SEAS5) are produced every month with a 51-member ensemble at ...
Interval/period: N/A
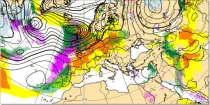
These charts aim to point towards areas where anomalous weather is likely to occur. ...
Interval/period: N/A
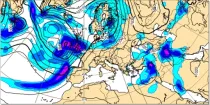
GraphCast (Google DeepMind): a deep learning-based system developed by Google DeepMind.It is initialised with ECMWF analysis. GraphCast operates at 0.25° resolution.
Interval/period: N/A
GraphCast (Google DeepMind): a deep learning-based system developed by Google DeepMind.It is initialised with ECMWF analysis. GraphCast operates at 0.25° resolution.
Interval/period: N/A
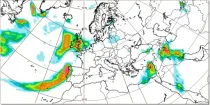
This chart shows probability information regarding point precipitation, as derived from the ...
Interval/period: N/A
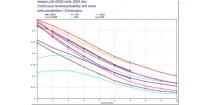
These diagrams compare the Brier Skill Scores (BSS) and the Continuous Ranked Probability ...
Interval/period: N/A
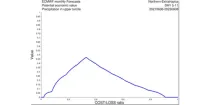
**Note:** In **June 2023** ECMWF implemented a **major upgrade ...**
Interval/period: N/A
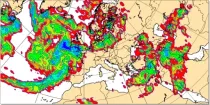
This chart is derived from the ECMWF ensemble (ENS) and shows the probability that the ...
Interval/period: N/A