
Datasets
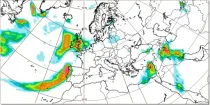
This chart shows probability information regarding point precipitation, as derived from the ...
Interval/period: N/A
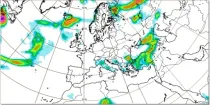
This chart shows probability information regarding point precipitation, as derived from the ...
Interval/period: N/A
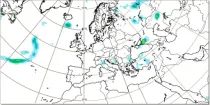
This chart shows probability information regarding point precipitation, as derived from the ...
Interval/period: N/A
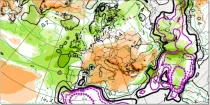
b'Detailed information on these EXPERIMENTAL products can be found
Interval/period: N/A
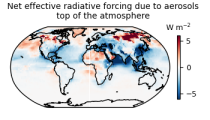
This dataset provides geographical distributions of the radiative forcing (RF) by key atmospheric constituents. The radiative forcing estimates are based on the CAMS reanalysis and additional model simulations and are provided separately for...
- carbon dioxide
- methane
- tropospheric ozone
- stratospheric ozone
- interactions between anthropogenic aerosols and radiation
Interval/period: N/A
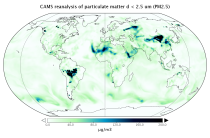
EAC4 (ECMWF Atmospheric Composition Reanalysis 4) is the fourth generation ECMWF global reanalysis of atmospheric composition. Reanalysis combines model data with observations from across the world into a globally complete and consistent dataset using a model of the atmosphere based on the laws of physics and chemistry.
Interval/period: N/A
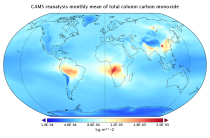
EAC4 (ECMWF Atmospheric Composition Reanalysis 4) is the fourth generation ECMWF global reanalysis of atmospheric composition. Reanalysis combines model data with observations from across the world into a globally complete and consistent dataset using a model of the atmosphere based on the laws of physics and chemistry.
Interval/period: N/A
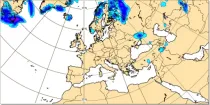
This chart shows the probability that the temperature at 2 m above the earth’s surface is below 0°C and the total of convective and broad scale precipitation ...
Interval/period: N/A
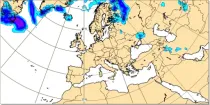
This chart shows the probability that both the wind at 10 m above the earth's surface is ...
Interval/period: N/A
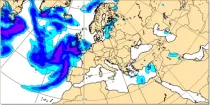
This chart shows the probability that both the wind at 10 m above the earth's surface is ...
Interval/period: N/A
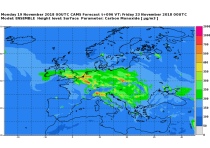
This dataset provides daily air quality analyses and forecasts for Europe.
Interval/period: N/A
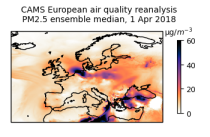
This dataset provides annual air quality reanalyses for Europe based on both unvalidated (interim) and validated observations.
Interval/period: N/A
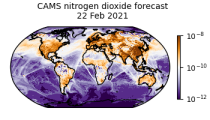
CAMS produces global forecasts for atmospheric composition twice a day. The forecasts consist of more than 50 chemical species (e.g. ozone, nitrogen dioxide, carbon monoxide) and seven different types of aerosol (desert dust, sea salt, organic matter, black carbon, sulphate, nitrate and ammonium aerosol). In addition, several meteorological variables are available as well.
Interval/period: N/A
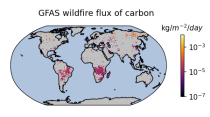
Emissions of atmospheric pollutants from biomass burning and vegetation fires are key drivers of the evolution of atmospheric composition, with a high degree of spatial and temporal variability, and an accurate representation of them in models is essential.
Interval/period: N/A
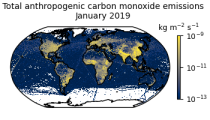
This data set contains gridded distributions of global anthropogenic and natural emissions.
Interval/period: N/A
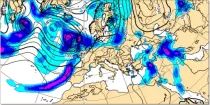
Precipitation totals include all precipitation types (rain, snow etc.) (in mm of rainfall or rainfall equivalent) falling in 6 hour or 12 hour periods using colour shading...
Interval/period: N/A
Total accumulated rainfall charts identify areas at greater risk of significant rainfall (or rain equivalent e.g.snowfall) but give no information regarding whether this occurs over a short or prolonged time period...
Interval/period: N/A
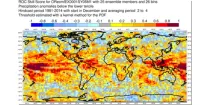
This chart shows the spatial variation in the Relative Operating Characteristics (ROC) skill ...
Interval/period: N/A
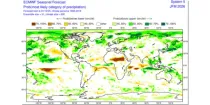
The ECMWF seasonal forecasts (SEAS5) are produced every month with a 51-member ensemble at a ...
Interval/period: N/A
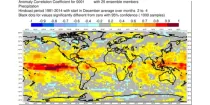
This chart shows the spatial variation in the Anomaly Correlation Coefficient (ACC) for the ...
Interval/period: N/A
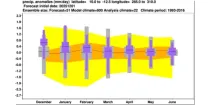
The ECMWF seasonal forecasts (SEAS5) are produced every month with a 51-member ensemble at ...
Interval/period: N/A
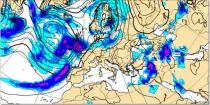
The charts show totals of large scale precipitation, convective precipitation, and the total of precipitation during the 6 hour period previous to the selected validity time...
Interval/period: N/A
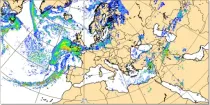
These charts show the rate of fall of large scale precipitation, the rate of fall of convective precipitation, the rate of fall of snowfall, or the rate of fall of all precipitation...
Interval/period: N/A
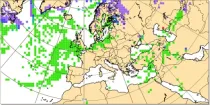
Where precipitation is forecast, a type of precipitation can be assigned according to the temperature structure of the model atmosphere that includes the layers through which the model precipitation falls...
Interval/period: N/A
This chart shows probabilities for the 7-day mean anomalies of precipitation to be in defined ...
Interval/period: N/A