Datasets

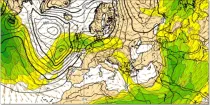
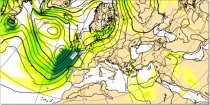
500-1000 hPa thickness is a measure of the mean temperature of a column of the atmosphere between these pressure levels and can be used to distinguish between warm and cold air masses and...
Interval/period: N/A

Aurora: a deep learning-based system developed by Microsoft. It is initialised with ECMWF analysis. Aurora operates at 0.1° resolution.
Interval/period: N/A

Aurora: a deep learning-based system developed by Microsoft. It is initialised with ECMWF analysis. Aurora operates at 0.1° resolution.
Interval/period: N/A
FourCastNet v2-small:a deep learning-based system developed by NVIDIA in collaboration with researchers at several US universities.It is initialised with ECMWF analysis. FourCastNet operates at 0.25° resolution.
Interval/period: N/A
FourCastNet v2-small:a deep learning-based system developed by NVIDIA in collaboration with researchers at several US universities.It is initialised with ECMWF analysis. FourCastNet operates at 0.25° resolution.
Interval/period: N/A
GraphCast (Google DeepMind): a deep learning-based system developed by Google DeepMind.It is initialised with ECMWF analysis. GraphCast operates at 0.25° resolution.
Interval/period: N/A

GraphCast (Google DeepMind): a deep learning-based system developed by Google DeepMind.It is initialised with ECMWF analysis. GraphCast operates at 0.25° resolution.
Interval/period: N/A
Detailed information on these EXPERIMENTAL products can be found
Interval/period: N/A
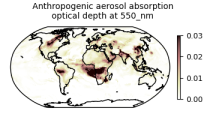
This dataset provides aerosol optical depths and aerosol-radiation radiative effects for four different aerosol origins: anthropogenic, mineral dust, marine, and land-based fine-mode natural aerosol. The latter mostly consists of biogenic aerosols.
Interval/period: N/A
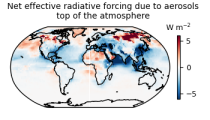
This dataset provides geographical distributions of the radiative forcing (RF) by key atmospheric constituents. The radiative forcing estimates are based on the CAMS reanalysis and additional model simulations and are provided separately for...
- carbon dioxide
- methane
- tropospheric ozone
- stratospheric ozone
- interactions between anthropogenic aerosols and radiation
Interval/period: N/A
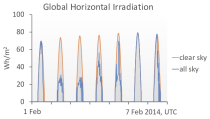
The CAMS solar radiation services provide historical values (2004 to present) of global (GHI), direct (BHI) and diffuse (DHI) solar irradiation, as well as direct normal irradiation (BNI). The aim is to fulfil the needs of European and national policy development and the requirements of both commercial and public downstream services, e.g. for planning, monitoring, efficiency improvements and the integration of solar energy systems into energy supply grids.
Interval/period: N/A

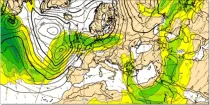
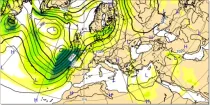
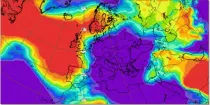
Wind speed at 200 hPa highlights the jet stream (areas of strong winds in the upper troposphere) which can help identify movement and development of depressions...
Interval/period: N/A

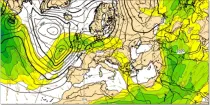
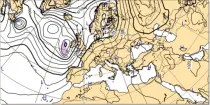
Wind speeds near the surface are roughly proportional to the distance between isobars so closely packed isobars mean strong surface winds...
Interval/period: N/A
Precipitation totals include all precipitation types (rain, snow etc.) (in mm of rainfall or rainfall equivalent) falling in 6 hour or 12 hour periods using colour shading...
Interval/period: N/A

This display helps with the recognition of clouds of different layers, even when they overlap. Brighter colouring represents greater cloud cover. Cloud-free areas appear white while areas of full cloud cover at all levels appear dark grey (e.g. active fronts)...
Interval/period: N/A
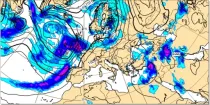
Precipitation totals include all precipitation types (rain, snow etc.) (in mm of rainfall or rainfall equivalent) falling in 6 hour or 12 hour periods using colour shading...
Interval/period: N/A

Wind speed at 200 hPa highlights the jet stream (areas of strong winds in the upper troposphere) which can help identify movement and development of depressions...
Interval/period: N/A

Wind speeds near the surface are roughly proportional to the distance between isobars so closely packed isobars mean strong surface winds...
Interval/period: N/A
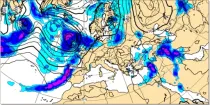
Precipitation totals include all precipitation types (rain, snow etc.) (in mm of rainfall or rainfall equivalent) falling in 6 hour or 12 hour periods using colour shading...
Interval/period: N/A

This display helps with the recognition of clouds of different layers, even when they overlap. Brighter colouring represents greater cloud cover. Cloud-free areas appear white while areas of full cloud cover at all levels appear dark grey (e.g. active fronts)...
Interval/period: N/A
AIFS ENS: a deep learning-based system developed by ECMWF. It is initialised with ECMWF perturbed forecasts and operates at N320 (~0.25Deg) resolution
Interval/period: N/A
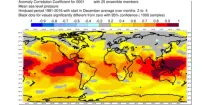
This chart shows the spatial variation in the Anomaly Correlation Coefficient (ACC) for the ...
Interval/period: N/A
Wind speed at 200 hPa highlights the jet stream (areas of strong winds in the upper troposphere) which can help identify movement and development of depressions...
Interval/period: N/A
Wind speeds near the surface are roughly proportional to the distance between isobars so closely packed isobars mean strong surface winds...
Interval/period: N/A
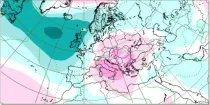
This chart shows probabilities for the 7-day mean anomalies of mean sea level pressure (mslp) to ...
Interval/period: N/A