Datasets
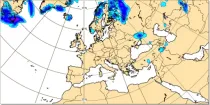
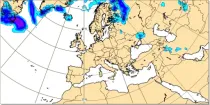
Forecast precipitation is considered to be snow if the model atmosphere above and at the ground surface is forecast to be below 0°C. Where the ground surface lies near the 0°C level...
Interval/period: N/A
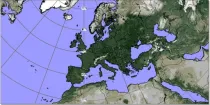
Lower values mean that more radiation is absorbed at the earth's surface while higher values mean more is reflected back to space. Albedo depends on the characteristics of the underlying surface and...
Interval/period: N/A
Bulk Wind Shear charts show the scalar value of the shear between the winds at the two pressure levels selected. Shear can be useful in assessing the strength of a front or...
Interval/period: N/A

Cloud base height is derived by upwardly searching the structure of the model atmosphere to find the altitude where the cloud fraction becomes >1% and...
Interval/period: N/A
This chart shows the probability that the temperature at 2 m above the earth’s surface is below 0°C and the total of convective and broad scale precipitation ...
Interval/period: N/A
This chart shows the probability that both the wind at 10 m above the earth's surface is ...
Interval/period: N/A
This chart shows the probability that both the wind at 10 m above the earth's surface is ...
Interval/period: N/A

This chart shows the probability that both the wind at 10 m above the earth's surface is ...
Interval/period: N/A
**Note:** In **June 2023** ECMWF implemented a **major upgrade ...**
Interval/period: N/A

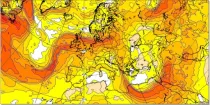
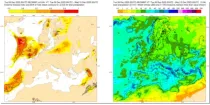
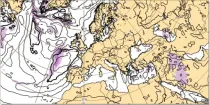
These charts show areas where anomalous CAPE are likely to occur.
Interval/period: N/A

These charts show areas where anomalous CAPE Shear are likely to occur.
Interval/period: N/A
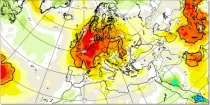
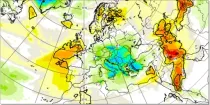
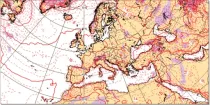
This chart aims to highlight areas where unusually anomalous 2 metre temperatures are ...
Interval/period: N/A
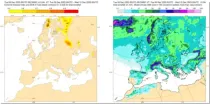
These charts aim to provide pointers to areas where anomalous precipitation amounts are likely to occur during the 24 hour, 2 day, 5 day or 10 day period previous to the selected validity time...
Interval/period: N/A
This chart aims to highlight areas where unusually anomalous precipitation is likely to ...
Interval/period: N/A
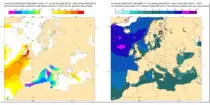
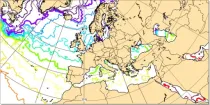
These charts show areas where anomalous significant wave heights are likely to occur. These charts are based on the ECMWF ense ...
Interval/period: N/A
These charts show areas where anomalous snow fall is likely to occur. These charts are based on the ECMWF ensemble for ...
Interval/period: N/A
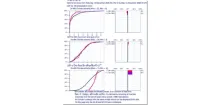
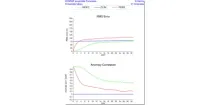
Cumulative Density Functions (CDF) describes the distribution of the values of a variable (e.g.temperature) as forecast by the ENS ensemble members. The CDF curve shows the proportion (in %) of ENS members...
Interval/period: N/A
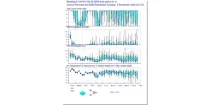
Meteograms show a probabilistic interpretation of the ENS forecasts for specific locations using a box and whisker plot. It shows the time evolution of the distribution of several meteorological parameters on a single diagram...
Interval/period: N/A
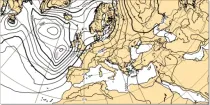
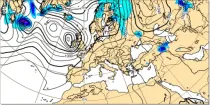
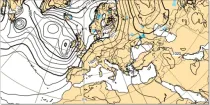
Ensemble Mean Sea Level Pressure (MSLP) is the mean MSLP of the ensemble members (in hPa) and detail is smoothed out. These charts show surface pressure patterns...
Interval/period: N/A
Spread usually, but not always, increases with forecast range. Spread refers to the uncertainty of the values of a parameter but it does not necessarily refer to the flow patterns...
Interval/period: N/A
The ensemble mean is the mean value derived from all the 50 ensemble members plus the control member. This value attempts to capture the general picture while smoothing out spurious detail...
Interval/period: N/A
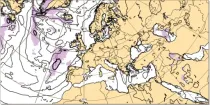
The ensemble spread is a measure of the differences between the 50 ensemble members plus the control member and is represented by the standard deviation with respect to the ensemble mean...
Interval/period: N/A
Spread refers to the uncertainty of the values of a parameter but it does not necessarily refer to the flow patterns...
Interval/period: N/A
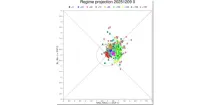
These diagrams aim to show the time evolution of regimes which are indicative of the likely weather in and around Europe.The winds across the Atlantic can usefully be classified into four regimes ...
Interval/period: N/A
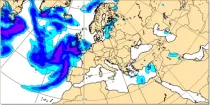
Where precipitation is forecast, a type of precipitation can be assigned according to the temperature structure of the model atmosphere that includes the layers through which the model precipitation falls...
Interval/period: N/A