Datasets
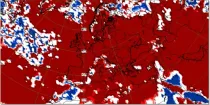
This chart shows probabilities that 7-day mean surface temperatures (from the 101 forecast ...
Interval/period: N/A
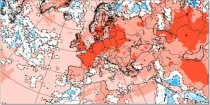
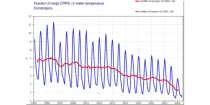
This chart shows 7-day mean anomalies of surface temperature from the ECMWF Sub-seasonal range ...
Interval/period: N/A
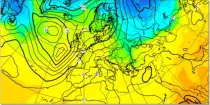
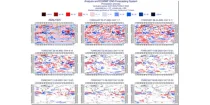
In the northern hemisphere the air rotates anti-clockwise around low contour centres and clockwise around the high contour centres. In the southern hemisphere the air rotates clockwise around low contour centres and ...
Interval/period: N/A
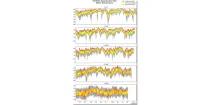
These diagrams compare scores of ensemble control (red) and ensemble members (central 50% of ...
Interval/period: N/A
This diagram gives a measure of the effectiveness of the model. ...
Interval/period: N/A

This diagram gives a measure of the effectiveness of the model. ...
Interval/period: N/A
**Note:** In **June 2023** ECMWF implemented a **major upgrade ...**
Interval/period: N/A
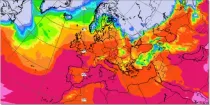
These charts represent the height of the air temperature 0°C isotherm or the Wet bulb temperature 0°C isotherm...
Interval/period: N/A
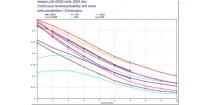
These diagrams compare the Brier Skill Scores (BSS) and the Continuous Ranked Probability ...
Interval/period: N/A