Datasets
AIFS ENS: a deep learning-based system developed by ECMWF. It is initialised with ECMWF perturbed forecasts and operates at N320 (~0.25Deg) resolution
Interval/period: N/A
AIFS ENS: a deep learning-based system developed by ECMWF. It is initialised with ECMWF perturbed forecasts and operates at N320 (~0.25Deg) resolution
Interval/period: N/A
AIFS ENS: a deep learning-based system developed by ECMWF. It is initialised with ECMWF perturbed forecasts and operates at N320 (~0.25Deg) resolution
Interval/period: N/A
Interval/period: Wed, 01/01/1986 - Sun, 12/31/2023
Interval/period: Wed, 01/01/1986 - Sun, 12/31/2023
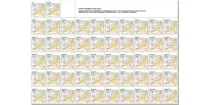
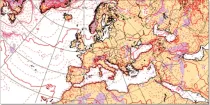
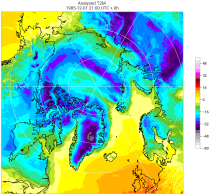
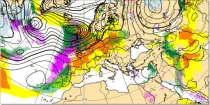
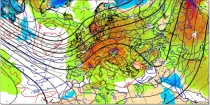
These charts show MSLP and 850hPa forecasts for the Ensemble Control Forecast, and 50 ENS ...
Interval/period: N/A
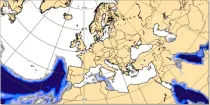
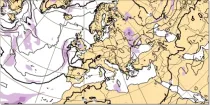
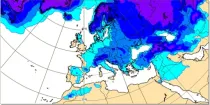
This chart shows probability information regarding dew point temperature 2 m above the ground derived from the ECMWF ensemble (ENS) at the validity time...
Interval/period: N/A
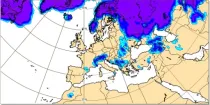
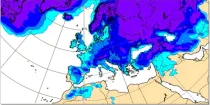
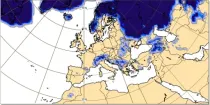
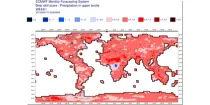
These charts are derived from the ECMWF ensemble forecast (ENS) system and show probability of 2 ...
Interval/period: N/A
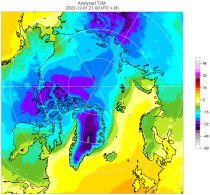
These charts are derived from the ECMWF ensemble forecast (ENS) system. They show probability ...
Interval/period: N/A
This chart shows probability information regarding maximum temperature 2 m above the ground derived from the ECMWF ensemble (ENS) during the 6 hour period preceding the validity time...
Interval/period: N/A
This chart shows probability information regarding minimum temperature 2 m above the ground derived from the ECMWF ensemble (ENS) during the 6 hour period preceding the validity time...
Interval/period: N/A
**Note:** In **June 2023** ECMWF implemented a **major upgrade ...**
Interval/period: N/A
These diagrams compare recent ECMWF verification scores for 500 hPa height with those of other ...
Interval/period: N/A
**Note:** In **June 2023** ECMWF implemented a **major upgrade ...**
Interval/period: N/A
This diagram gives a measure of the effectiveness of the model. The drop-down menu can ...
Interval/period: N/A
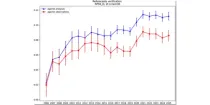
This diagram gives a measure of the effectiveness of the model. ...
Interval/period: N/A
**Note:** In **June 2023** ECMWF implemented a **major upgrade ...**
Interval/period: N/A

This diagram gives a measure of the effectiveness of the model. ...
Interval/period: N/A
**Note:** In **June 2023** ECMWF implemented a **major upgrade ...**
Interval/period: N/A

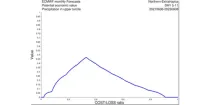
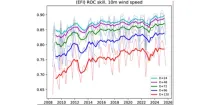
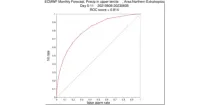
This diagram shows the variation of Relative Operating Characteristics (ROC) scores with various ...
Interval/period: N/A
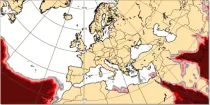
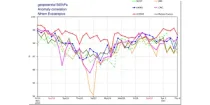
These charts aim to point towards areas where anomalous weather is likely to occur. ...
Interval/period: N/A
This chart shows 7-day mean anomalies for a range of parameters from the ECMWF Sub-seasonal ...
Interval/period: N/A
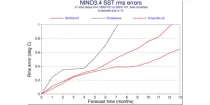
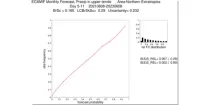
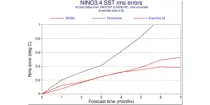
This chart provides a range of skill scores relating to forecasts of the evolution of the sea ...
Interval/period: N/A
This chart provides a range of skill scores relating to forecasts of the evolution of the sea ...
Interval/period: N/A
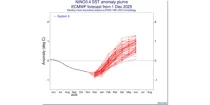
*From the 1st Jan 2023, all Nino plots are based on the use of ERA5 SST instead of NCEP ...*
Interval/period: N/A