Datasets
Interval/period: Mon, 01/01/1951 - Sat, 07/04/2026
Interval/period: N/A
Interval/period: Sun, 01/01/1950 - Wed, 12/01/2100
Interval/period: Sun, 01/01/1860 - Mon, 12/31/2300
Interval/period: Sun, 01/01/1950 - Fri, 12/31/2100
Interval/period: N/A
Interval/period: Mon, 01/01/1940 - Fri, 12/31/2100
Interval/period: N/A
Interval/period: Sun, 01/01/1860 - Mon, 12/31/2300
Interval/period: Wed, 01/01/1800 - Fri, 12/31/2100
Interval/period: Sun, 01/01/1860 - Mon, 12/31/2300
Interval/period: Sun, 01/01/1860 - Mon, 12/31/2300
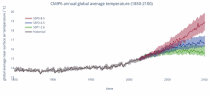
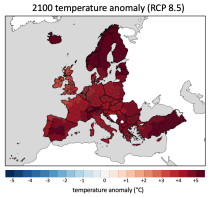
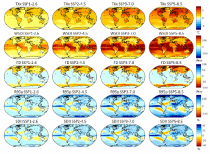
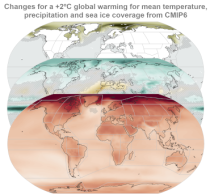
CMIP6 data underpins the Intergovernmental Panel on Climate Change 6th Assessment Report. The use of these data is mostly aimed at:
addressing outstanding scientific questions that arose as part of the IPCC reporting process;
improving the understanding of the climate system;
Interval/period: Sun, 01/01/1860 - Mon, 12/31/2300
Interval/period: Sun, 01/01/1950 - Thu, 12/31/2099
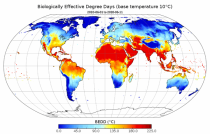
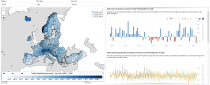
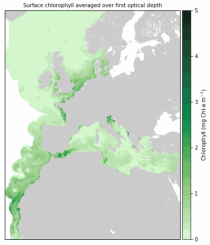
ECV datasets provide the empirical evidence needed to understand the current climate and predict future changes.
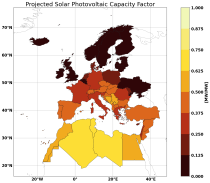
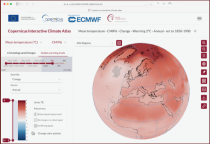
CIIs contain condensed climate information which facilitate relatively quick and efficient subsequent analysis. Therefore, CIIs make climate information accessible to application focussed users within a sector.
Interval/period: N/A
Interval/period: Wed, 01/01/1986 - Mon, 12/31/2085
Interval/period: Sun, 01/01/1950 - Thu, 12/31/2099
Interval/period: Mon, 01/01/1951 - Sat, 12/31/2050
Interval/period: Sun, 01/01/1950 - Sat, 12/31/2050
Interval/period: Sun, 01/01/1860 - Mon, 12/31/2300
Interval/period: Sun, 01/01/1860 - Mon, 12/31/2300
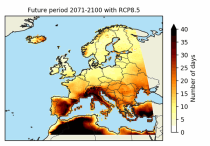
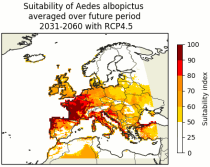
These heat wave and cold spell days are available for different future time periods and use different climate change scenarios.
Interval/period: Wed, 01/01/1986 - Mon, 12/31/2085
Interval/period: Mon, 01/01/1979 - Mon, 12/31/2018
ECV datasets provide the empirical evidence needed to understand the current climate and predict future changes.
Interval/period: N/A
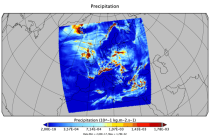
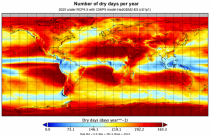
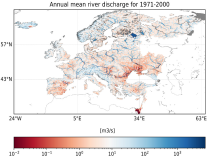
The data are bias adjusted using the Distribution Based Scaling (DBS) method versus the global reference dataset HydroGFD2.0, both bias adjustment method and global reference dataset developed by the Swedish Meteorological and Hydrological Institute (SMHI).
The DBS method is a parametric quantile-mapping variant.
Interval/period: Thu, 10/12/2000 - Thu, 10/18/2018