Datasets
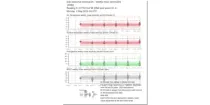
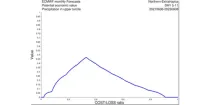
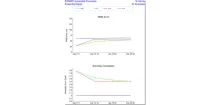
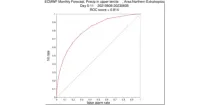
This product shows ENS meteograms from next model version of IFS cycle 50R1 that is planned to be ...
Interval/period: N/A
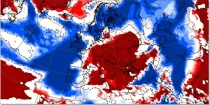
This chart shows probabilities for the 7-day mean anomalies of 2 m air temperature to be in ...
Interval/period: N/A
This chart shows probabilities that 7-day mean 2 m air temperatures (from the 101 forecast ...
Interval/period: N/A
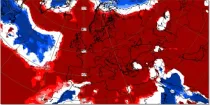
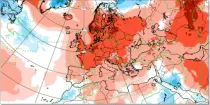
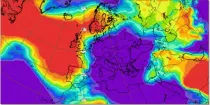
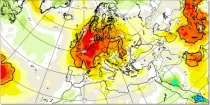
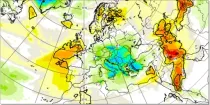
This chart shows 7-day mean anomalies of 2m air temperature from the ECMWF Sub-seasonal range ...
Interval/period: N/A
Detailed information on these EXPERIMENTAL products can be found
Interval/period: N/A
Detailed information on these EXPERIMENTAL products can be found
Interval/period: N/A
b'Detailed information on these EXPERIMENTAL products can be found
Interval/period: N/A
Detailed information on these EXPERIMENTAL products can be found
Interval/period: N/A
**Note:** In **June 2023** ECMWF implemented a **major upgrade ...**
Interval/period: N/A
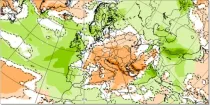
This chart shows probabilities for the 7-day mean anomalies of mean sea level pressure (mslp) to ...
Interval/period: N/A
This chart shows probabilities that the 7-day mean of mean sea level pressure (from the 101 ...
Interval/period: N/A
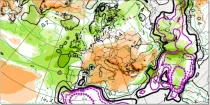
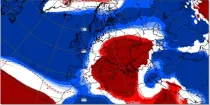
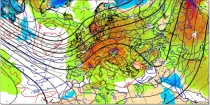
This chart shows 7-day mean anomalies of mean sea level pressure (mslp) from the ECMWF ...
Interval/period: N/A
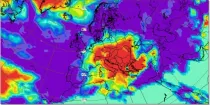
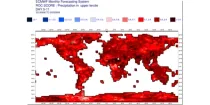
This chart shows probabilities for the 7-day mean anomalies of precipitation to be in defined ...
Interval/period: N/A
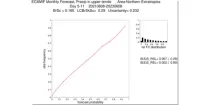
This chart shows probabilities that 7-day-total precipitation (from the 101 forecast members) ...
Interval/period: N/A
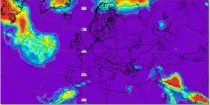
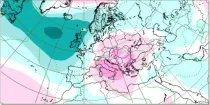
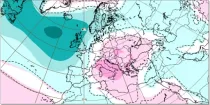
This chart shows 7-day mean anomalies of precipitation accumulation amounts from the ECMWF ...
Interval/period: N/A
**Note:** In **June 2023** ECMWF implemented a **major upgrade ...**
Interval/period: N/A
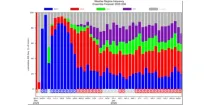
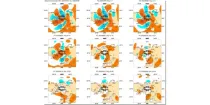
This diagram shows daily probabilities for four types of Euro-Atlantic weather regimes over ...
Interval/period: N/A
**Note:** In **June 2023** ECMWF implemented a **major upgrade ...**
Interval/period: N/A
**Note:** In **June 2023** ECMWF implemented a **major upgrade ...**
Interval/period: N/A
**Note:** In **June 2023** ECMWF implemented a **major upgrade ...**
Interval/period: N/A
**Note:** In **June 2023** ECMWF implemented a **major upgrade ...**
Interval/period: N/A
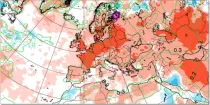
This chart shows 7-day mean anomalies for a range of parameters from the ECMWF Sub-seasonal ...
Interval/period: N/A
**Note:** In **June 2023** ECMWF implemented a **major upgrade ...**
Interval/period: N/A
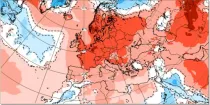
This chart aims to highlight areas where unusually anomalous 2 metre temperatures are ...
Interval/period: N/A
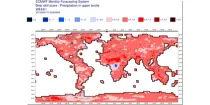
This chart aims to highlight areas where unusually anomalous precipitation is likely to ...
Interval/period: N/A