Datasets
Displaying 1 - 5 of 5
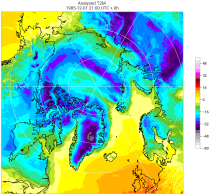
The C3S Arctic Regional Reanalysis second generation (CARRA2) dataset contains daily and monthly meteorological variables at 2.5 km resolution. These variables are specified at single levels (including surface) and also at soil, height, pressure and model levels. These daily and monthly data are pre-calculated and have the following types depending on the variables: daily and monthly averages, extremes and totals.
Interval/period: Wed, 01/01/1986 - Sun, 12/31/2023
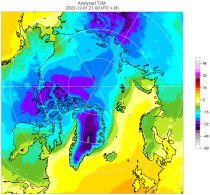
The C3S Arctic Regional Reanalysis second generation (CARRA2) dataset contains 3-hourly analyses at 2.5 km resolution. These variables are specified at single levels (including surface) and also at soil, height, pressure and model levels. Additionally, hourly forecasts are available between the analysis times and particularly forecasts up to 18 hours initialised from the analyses at 00 and 12 UTC.
Interval/period: Wed, 01/01/1986 - Sun, 12/31/2023
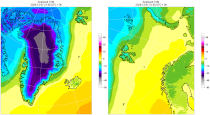
The daily and monthly data of the C3S Arctic Regional Reanalysis (CARRA) dataset contains daily and monthly meteorological variables at 2.5 km resolution. This includes fields at the single levels (including surface) and on pressure, height, soil and model levels.
These daily and monthly data are pre-calculated and have the following types depending on the variables: daily and monthly averages, extremes and totals.
These daily and monthly data are pre-calculated and have the following types depending on the variables: daily and monthly averages, extremes and totals.
Interval/period: Sat, 09/01/1990 - Sat, 02/28/2026
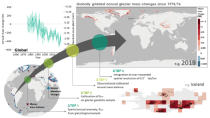
The dataset provides global annual glacier mass changes distributed on a global regular grid at 0.5° resolution (latitude, longitude) based on the Fluctuations of Glaciers (FoG) database of the World Glacier Monitoring Service (WGMS). Glaciers play a fundamental role in the Earth’s water cycles. They are one of the most important freshwater resources for societies and ecosystems and the recent increase in ice melt contributes directly to the rise of ocean levels.
Interval/period: Wed, 01/01/1975 - Sun, 05/10/2026
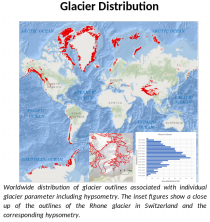
This dataset, commonly known as the Randolph Glacier Inventory (RGI), provides global glacier outlines compiled from maps, aerial photographs and satellite images. The data is provided as a "snapshot" (single time-slice) constructed from images that were mostly acquired in the period 2000-2010.
Interval/period: Sat, 01/01/2000 - Sun, 12/31/2000