Datasets
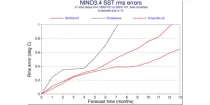
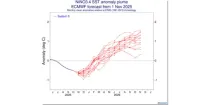
This chart provides a range of skill scores relating to forecasts of the evolution of the sea ...
Interval/period: N/A
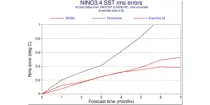
This chart provides a range of skill scores relating to forecasts of the evolution of the sea ...
Interval/period: N/A
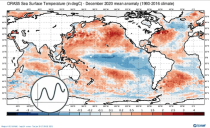
*From the 1st Jan 2023, all Nino plots are based on the use of ERA5 SST instead of NCEP ...*
Interval/period: N/A
*From the 1st Jan 2023, all Nino plots are based on the use of ERA5 SST instead of NCEP ...*
Interval/period: N/A
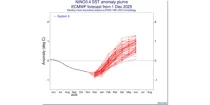
**Note:** In **June 2023** ECMWF implemented a **major upgrade ...**
Interval/period: N/A

Interval/period: N/A
Interval/period: N/A
Interval/period: N/A
Interval/period: N/A
Interval/period: N/A
Interval/period: N/A
Interval/period: N/A
These diagrams show verification scores for significant wave height and 10 m wind for three ...
Interval/period: N/A
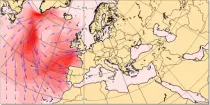
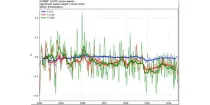
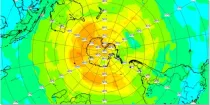
These charts show the the wave energy flux (in kW m⁻¹) calculated as the integral, over all forecast wave frequencies and wave directions, of the product of the wave group speed and the two-dimensional energy wave spectrum...
Interval/period: N/A
Interval/period: Wed, 01/01/1958 - Wed, 01/01/2025
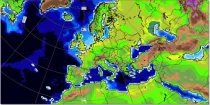
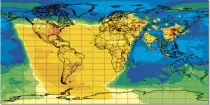
The height of topography above mean sea level and the depth of the sea for each model grid box ...
Interval/period: N/A

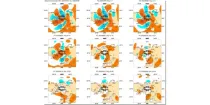
4-month long 101-ensemble member seasonal attribution experiment (PC98) initialised on 01-November-1997 using the atmosphere-only version of SEAS5 (see Johnson et al., 2019) forced with daily ERA5 SST as in the reference experiment (R98) but with daily SST climatology over the tropical Pacific Ocean.
Examples
Interval/period: N/A
Interval/period: N/A
Interval/period: N/A
Interval/period: N/A
Interval/period: N/A
Interval/period: N/A
Interval/period: N/A