Datasets
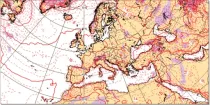
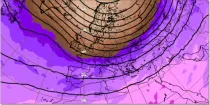
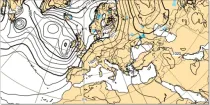
The ensemble mean is the mean value derived from all the 50 ensemble members plus the control member. This value attempts to capture the general picture while smoothing out spurious detail...
Interval/period: N/A
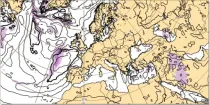
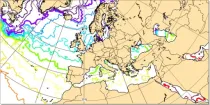
The ensemble spread is a measure of the differences between the 50 ensemble members plus the control member and is represented by the standard deviation with respect to the ensemble mean...
Interval/period: N/A
These charts show the mean and variation in the latest ECMWF ensemble forecast (ENS). ...
Interval/period: N/A
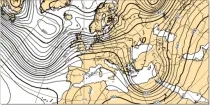
These charts show the mean and variation in the latest ECMWF ensemble forecast (ENS). ...
Interval/period: N/A

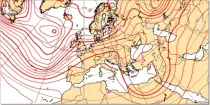
These charts show the mean and variation in the latest ECMWF ensemble forecast (ENS). ...
Interval/period: N/A
Spread refers to the uncertainty of the values of a parameter but it does not necessarily refer to the flow patterns...
Interval/period: N/A
These charts show the mean and variation in the latest ECMWF ensemble forecast (ENS). ...
Interval/period: N/A

One model cycle of ECMWF ensemble prediction system set up to explore data information content in the scope of a ESoWC project. Perturbed and control forecast of temperature on 91 model levels are archived. The data is encoded as IEEE single-precision (32-bit floats) circumventing any other lossy compression. This is in contrast to the default 16- or 24-bit linear packing used in the ECMWF data archive. The volume of the full experiment is 1 TB.
Examples
Interval/period: N/A
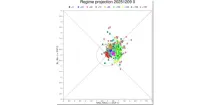
These diagrams aim to show the time evolution of regimes which are indicative of the likely weather in and around Europe.The winds across the Atlantic can usefully be classified into four regimes ...
Interval/period: N/A

The EU-funded ENSEMBLES project intends to develop an ensemble prediction system for climate change based on the principal state-of-the-art, high resolution, global and regional Earth System models developed in Europe, validated against quality controlled, high resolution gridded datasets for Europe, to produce for the first time, an objective probabilistic estimate of uncertainty in future climate at the seasonal to decadal and longer timescales.
Interval/period: N/A
This experiment is a prototype. It has several important limitations. It is not an ERA6 production. It has known missing components. It should not be used for any application or publication. It should be used to provide feedback to ECMWF.
Examples
Interval/period: N/A
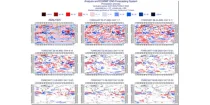
This diagram gives a measure of the effectiveness of the model. ...
Interval/period: N/A

This diagram gives a measure of the effectiveness of the model. ...
Interval/period: N/A
Where precipitation is forecast, a type of precipitation can be assigned according to the temperature structure of the model atmosphere that includes the layers through which the model precipitation falls...
Interval/period: N/A
Forecasts using IFS EPS CY47R3 replicating operations (51 members, TCo639, ORCA025Z75). The ocean state has had a hydrostatically balanced estimate of anthropogenic influence (warming) since 1850-1900 added, such that the total anthropogenic influence is twice estimated at the present day (an equal but opposite perturbation to expid b2nn). The CO2 concentration was set to 625 ppm.
Interval/period: N/A
Forecasts using IFS EPS CY47R2 replicating operations (51 members, TCo639, ORCA025Z75). The ocean state has had a hydrostatically balanced estimate of anthropogenic influence (warming) since 1850-1900 added, such that the total anthropogenic influence is twice estimated at the present day (an equal but opposite perturbation to expid b2mg). The CO2 concentration was set to 615 ppm. If you are interested in using these data, please let us know by contacting nicholas.leach@physics.ox.ac.uk .
Interval/period: N/A
Forecasts using IFS EPS CY47R2 replicating operations (51 members, TCo639, ORCA025Z75). The ocean state has had a hydrostatically balanced estimate of anthropogenic influence (warming) within the CMCC-CM2-HR4 climate model since 1850-1900 added, such that the total anthropogenic influence is twice estimated at the present day (an equal but opposite perturbation to expid b2mk). The CO2 concentration was set to 615 ppm.
Interval/period: N/A
**Note:** In **June 2023** ECMWF implemented a **major upgrade ...**
Interval/period: N/A
Long-range reforecast experiment covering the period 1901-2010 with a low-resolution configuration of SEAS5 To explore ENSO predictability up to 2 years. The reforecasts are initialised with the coupled reanalysis of the 20th Century CERA-20C.
Examples
Interval/period: N/A
Long-range ensemble forecast experiment initialised on 1st May 2022 covering the 4 months up to the end of August 2022 with atmospheric CO2 concentrations reduced to pre-industrial levels of 285 ppm
Examples
Interval/period: N/A
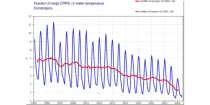
Global relaxation experiment run at Tco199 for 46 days over 20 years starting on 12, 16 , 19, 23, 26 , 30 December and 2nd, 6th and 9th January 1999-2018.
Examples
retrieve, class=rd, stream=enfh, expver=iknn, type=pf, number=1/to/4, levtype=sfc, param=2t, date=20191212, hdate=20091212, time=00:00:00, step=24, target='output.grib'Retrieving 2-meter temperature of the hindcast starting on 12 December 2019 for all perturbed members.
Interval/period: N/A
TCo399 experiment denying the assimilation of GNSS-RO observations between 20201001-20210430.
Examples
retrieve, anoffset=12, class=rd, date=2020-10-01/to/2021-04-30, expver=ibx8, levelist=1/2/3/5/7/10/20/30/50/70/100/150/200/250/300/400/500/600/700/800/850/900/925/950/1000, levtype=pl, param=129.128, step=0, stream=lwda, time=09:00:00/21:00:00, type=4v, target="output"Retrieve geopotential analysis fields on pressure levels
Interval/period: N/A
TCo399 experiment denying the assimilation of GNSS-RO observations between 20211001-20220430.
Examples
retrieve, anoffset=12, class=rd, date=2021-10-01/to/2022-04-30, expver=ibyo, levelist=1/2/3/5/7/10/20/30/50/70/100/150/200/250/300/400/500/600/700/800/850/900/925/950/1000, levtype=pl, param=129.128, step=0, stream=lwda, time=09:00:00/21:00:00, type=4v, target="output"Retrieve geopotential analysis fields on pressure levels
Interval/period: N/A
TCo399 experiment denying the assimilation of GNSS-RO observations between 20221001-20230430.
Examples
retrieve, anoffset=12, class=rd, date=2022-10-01/to/2023-04-30, expver=ic2g, levelist=1/2/3/5/7/10/20/30/50/70/100/150/200/250/300/400/500/600/700/800/850/900/925/950/1000, levtype=pl, param=129.128, step=0, stream=lwda, time=09:00:00/21:00:00, type=4v, target="output"Retrieve geopotential analysis fields on pressure levels
Interval/period: N/A
TCo399 experiment denying the assimilation of GNSS-RO observations between 20231001-20240430.
Examples
retrieve, anoffset=12, class=rd, date=2023-10-01/to/2024-04-30, expver=ic0t, levelist=1/2/3/5/7/10/20/30/50/70/100/150/200/250/300/400/500/600/700/800/850/900/925/950/1000, levtype=pl, param=129.128, step=0, stream=lwda, time=09:00:00/21:00:00, type=4v, target="output"Retrieve geopotential analysis fields on pressure levels
Interval/period: N/A