Datasets

This is an extension of the i4ql experiment covering the period 2025-07-27 to 2023-08-10
Examples
retrieve, class=rd, stream=oper, expver=abcd, type=fc, levtype=sfc, param=2t, date=2000-01-01, time=00:00:00, step=24, target='output.grib' retrieve, class=rd, stream=oper, expver=abcd, type=fc, levtype=sfc, param=2t, date=2000-01-01, time=00:00:00, step=24, target='output.grib'Interval/period: N/A
Control experiment (CTRL) for an assimilation test with near-real time TROPOMI total column CO data (exp=hmib) using the CAMS CY47R3 configuration. In CTRL, MOPITT TIR and IASI TCCO are assimilated, but TROPOMI TCCO data are passive.
Examples
retrieve, class=rd, stream=oper, expver=hlxm, type=an, levtype=sfc, param='tcco', date=2021-08-01, time=00:00:00, step=0, target='output.grib'Retrieval of total column CO analysis
Interval/period: N/A
Analysis experiment (ASSIM) testing the assimilation of near-real time TROPOMI total column CO data in the CAMS CY47R3 system for the period 6/7-31/12/2021 (in addition to already assimilated MOPITT TIR and IASI TCCO).
Examples
retrieve, class=rd, stream=oper, expver=hmib, type=an, levtype=sfc, param='tcco', date=2021-08-01, time=00:00:00, step=0, target='output.grib'Retrieval of total column CO analysis
Interval/period: N/A
Control experiment for a series of SO2 assimilation tests for the 2019 Raikoke eruption with the CAMS system which assess the impact of assimilating SO2 layer height data (V3.1 FP_ILM). In BLexp (hhu5) ESA NRT SO2 data were assimilated.
Examples
retrieve, class=rd, stream=oper, expver=hhu5, type=fc, levtype=sfc, param=210126, date=2019-06-23, time=00:00:00, step=24, target='output.grib'Retrieval of total column SO2 forecast at step 24
Interval/period: N/A
Layer height experiment for a series of SO2 assimilation tests for the 2019 Raikoke eruption with the CAMS system which assess the impact of assimilating SO2 layer height data (V3.1 FP_ILM). In LH1.4 (hgz7) SO2 Layer Height data produced with FP_ILM (V3.1) were assimilated with SO2 background error standard deviation values of 1.4e-7 kg/kg and horizontal background error correlation length scale of 100 km.
Examples
Interval/period: N/A
Layer height experiment for a series of SO2 assimilation tests for the Raikoke eruption with the CAMS system which assess the impact of assimilating SO2 layer height data (V3.1 FP_ILM). In LH100 (hhtm) SO2 Layer Height data produced with FP_ILM (V3.1) were assimilated with SO2 background error standard deviation values of 1e-7 kg/kg and horizontal background error correlation length scale of 100 km.
Examples
Interval/period: N/A
Layer height experiment for a series of SO2 assimilation tests for the 2019 Raikoke eruption with the CAMS system which assess the impact of assimilating SO2 layer height data (V3.1 FP_ILM). In LH250 (hhtn) SO2 Layer Height data produced with FP_ILM (V3.1) were assimilated with SO2 background error standard deviation values of 1e-7 kg/kg and horizontal background error correlation length scale of 250 km.
Examples
Interval/period: N/A
Layer height experiment for a series of SO2 assimilation tests for the 2019 Raikoke eruption with the CAMS system which assess the impact of assimilating SO2 layer height data (V3.1 FP_ILM). In LH50 (hhbu) SO2 Layer Height data produced with FP_ILM (V3.1) were assimilated with SO2 background error standard deviation values of 1e-7 kg/kg and horizontal background error correlation length scale of 50 km.
Examples
Interval/period: N/A
Layer height experiment for a series of SO2 assimilation tests for the 2019 Raikoke eruption with the CAMS system which assess the impact of assimilating SO2 layer height data (V3.1 FP_ILM). In LHexp (hgze) SO2 Layer Height data produced with FP_ILM (V3.1) were assimilated with SO2 background error standard deviation values of 0.7e-7 kg/kg and horizontal background error correlation length scale of 100 km.
Examples
Interval/period: N/A
Probabilistic 15-day TCo1279L137 forecast with CY49R1.1. 8 ENS members. Control for the nudged experiments. 00/12UTC start from 1 December 2024 to 28 February 2025.
Examples
Interval/period: N/A
Probabilistic 15-day TCo1279L137 forecast with CY49R1.1. 8 ENS members. Control for the nudged experiments. 00/12UTC start from 1 July 2024 to 12 November 2024.
Examples
Interval/period: N/A
Probabilistic 15-day TCo1279L137 forecast with CY49R1.1. 8 members. Vorticity and virtual temperature below tropopause nudged to equivalent members from model level AIFS-CRPS ML model for total wavenumbers <21. 00/12UTC start from 1 July 2024 to 30 September 2024. Only perturbed forecasts should be analysed.
Examples
Interval/period: N/A
Probabilistic 15-day TCo1279L137 forecast with CY49R1.1. 8 members. Vorticity and virtual temperature below tropopause nudged to equivalent members from model level AIFS-CRPS ML model for total wavenumbers <21. 00/12UTC start from 1 December 2024 to 28 February 2025. Only perturbed forecasts should be analysed.
Examples
Interval/period: N/A
Probabilistic 15-day TCo1279L137 forecast with CY49R1.1. 8 members. Vorticity and virtual temperature below tropopause nudged to equivalent members from model level AIFS-CRPS ML model for total wavenumbers <21. 00/12UTC start from 1 October 2024 to 12 November 2024. Only perturbed forecasts should be analysed.
Examples
Interval/period: N/A
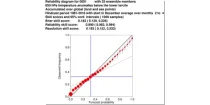
The reliability diagram shows the reliability of the ECMWF seasonal forecast system (SEAS5) with ...
Interval/period: N/A
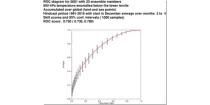
This chart shows the Relative Operating Characteristics (ROC) diagram for the three-month ...
Interval/period: N/A
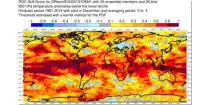
This chart shows the spatial variation in the Relative Operating Characteristics (ROC) skill ...
Interval/period: N/A
The ECMWF seasonal forecasts (SEAS5) are produced every month with a 51-member ensemble at a ...
Interval/period: N/A

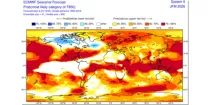
This chart shows the spatial variation in the Anomaly Correlation Coefficient (ACC) for the ...
Interval/period: N/A

This chart provides information on the verification of forecasts of Accumulated Cyclone Energy ...
Interval/period: N/A

The ECMWF seasonal forecasts (SEAS5) are produced every month with a 51-member ensemble at a ...
Interval/period: N/A
Interval/period: Sun, 01/01/1978 - Wed, 10/17/2018
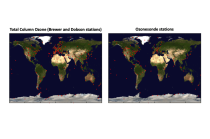
The total ozone estimates are based on solar UV radiation measurements made by ground-based spectrophotometers (Dobson or Brewer type spectrophotometers).
The vertical profiles of ozone concentration are estimated primarily using ozonesonde observations.
Data are available for 159 Dobson stations, 109 Brewer stations and 135 ozonesondes stations.
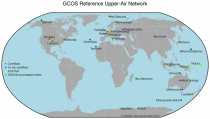
Interval/period: Tue, 01/01/1924 - Sat, 05/09/2026
(GNSS) radio signals.
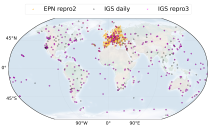
The initial data is collected from two in situ ground-based network of GNSS receivers – the International GNSS Service
(IGS) and EUREF Permanent Network (EPN). The IGS collects, archives, and freely distributes GNSS data from a
cooperatively operated global network of more than 500 ground-based GNSS stations since 1994. The EPN is a European
Interval/period: Mon, 01/01/1996 - Sat, 05/09/2026
Forecasts using IFS EPS CY47R2 replicating operations (51 members, TCo639, ORCA025Z75). The CO2 concentration was set to 615 ppm. If you are interested in using these data, please let us know by contacting nicholas.leach@physics.ox.ac.uk .
Examples
Interval/period: N/A