Datasets

Single forecast runs produced by the ECMWF Artificial Intelligence Forecasting System (AIFS) deterministic model.
Interval/period: N/A
On 12 May 2026, a new forecast stream will be produced by ECMWF's operational Artificial Intelligence Forecasting System deterministic model (AIFS Single).
The new forecast stream is for wave forecast runs, marking ECMWF's first operational data-driven wave forecasts.
Interval/period: N/A
ECMWF is now running its own Artificial Intelligence Forecasting System (AIFS). The AIFS consists of a deterministic model and an ensemble model. The deterministic model has been running operationally since 25 February 2025; further details can be found on the dedicated Implementation of AIFS Single v1 page.
Interval/period: N/A
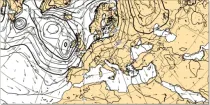
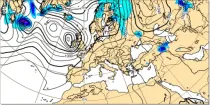
These charts show surface pressure patterns. Areas of high pressure (anticyclones) are usually associated with settled weather...
Interval/period: N/A
Dew Point Temperature at 2 m above the earth’s surface gives an indication of conditions which a person will experience or feel. High dewpoint temperatures inhibit heat loss from the body by perspriation and...
Interval/period: N/A
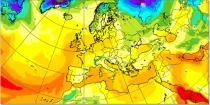
Temperatures at 2 m above the earth’s surface and winds at 10 m above the earth’s surface approximate most closely to the conditions that a person would experience.
Interval/period: N/A
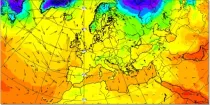
The 850 hPa level is usually just above the boundary layer and at this level the day-night variation in temperature is generally negligible...
Interval/period: N/A

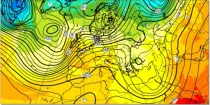
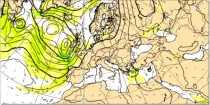
Wind speed at 200 hPa highlights the jet stream (areas of strong winds in the upper troposphere) which can help identify movement and development of depressions...
Interval/period: N/A

Wind speeds near the surface are roughly proportional to the distance between isobars so closely packed isobars mean strong surface winds...
Interval/period: N/A
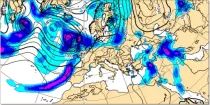
Precipitation totals include all precipitation types (rain, snow etc.) (in mm of rainfall or rainfall equivalent) falling in 6 hour or 12 hour periods using colour shading...
Interval/period: N/A
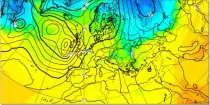
In the northern hemisphere the air rotates anti-clockwise around low contour centres and clockwise around the high contour centres. In the southern hemisphere the air rotates clockwise around low contour centres and ...
Interval/period: N/A
Total accumulated rainfall charts identify areas at greater risk of significant rainfall (or rain equivalent e.g.snowfall) but give no information regarding whether this occurs over a short or prolonged time period...
Interval/period: N/A
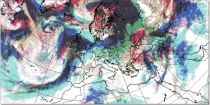
This display helps with the recognition of clouds of different layers, even when they overlap. Brighter colouring represents greater cloud cover. Cloud-free areas appear white while areas of full cloud cover at all levels appear dark grey (e.g. active fronts)...
Interval/period: N/A
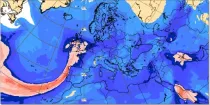
The charts show the forecast value of the vertically integrated total column water (vapour + cloud water + cloud ice but with no precipitation included) in units of kg m⁻²...
Interval/period: N/A
Forecast precipitation is considered to be snow if the model atmosphere above and at the ground surface is forecast to be below 0°C. Where the ground surface lies near the 0°C level...
Interval/period: N/A
The air flow is not the same at all levels and can be very different in strength and direction when associated with vigorous weather systems...
Interval/period: N/A

noAircraft experiment (other all usual observation types assimilated) for aircraft Observing System Experiment (OSE) see Ingleby et al (2021), https://doi.org/10.1029/2020GL090699 . Experiment from 2019-01-28 to 2019-04-30, control is h4qi.
Examples
Interval/period: N/A
noAircraftT experiment (other all usual observation types assimilated) for aircraft Observing System Experiment (OSE) see Ingleby et al (2021), https://doi.org/10.1029/2020GL090699 . Experiment from 2019-01-28 to 2019-04-30, control is h4qi.
Examples
Interval/period: N/A
Lower values mean that more radiation is absorbed at the earth's surface while higher values mean more is reflected back to space. Albedo depends on the characteristics of the underlying surface and...
Interval/period: N/A
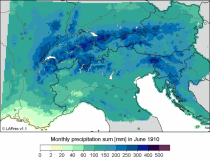
LAPrec1871 starts in 1871 and is based on data from 85 input series;
LAPrec1901 starts in 1901 and is based on data from 165 input series.
Interval/period: Sun, 01/01/1871 - Mon, 05/11/2026
Research analysis experiment produced with ECMWF IFS cycle 47R1, at TCo399 (25km), for the EUREC4A field campaign (15.01.2020-14.02.2020). The dropsondes launched in the campaign are denied from the data assimilation.
Examples
retrieve, class=rd, stream=lwda, expver=hfa8, type=an, levtype=ml, levellist=137/to/106, param=T/Q, date=2020-01-16, time=00:00:00, step=0, target='TQ_0utc.grib'Retrieval of temperature and humidity from the analysis on model levels on original model grid
Interval/period: N/A
Analysis experiement with the IFS cycle 47R1, on a cubic horizontal grid with a 399 spectral truncature, and 137 vertical levels. The cloud sink control variable is turned off. Experiment described as TOVSCV in Massart et al. (2021). Period of interest: 1 July 2019 to 30 September 2019.
Examples
retrieve, class=rd, stream=lwda, expver=hg65, type=fc, levtype=sfc, param=skt, date=2019-07-01, time=06:00:00, step=3, target='output.grib'Skin temperature forecast at time 06:00Z for 1 July 2019
Interval/period: N/A
Analysis experiement with the IFS cycle 47R1, on a cubic horizontal grid with a 399 spectral truncature, and 137 vertical levels. The cloud sink control variable is turned off. Experiment described as TOVSCV in Massart et al. (2021). Period of interest: 1 January 2020 to 31 March 2020.
Examples
retrieve, class=rd, stream=lwda, expver=hgef, type=fc, levtype=sfc, param=skt, date=2020-01-01, time=06:00:00, step=3, target='output.grib'Skin temperature forecast at time 06:00Z for 1 January 2020
Interval/period: N/A
These charts show the difference between the latest HRES Long Window Data Analysis (LWDA) for the main synoptic hours of 00, 06, 12 and 18UTC, and its corresponding background field taken from the previous HRES LWDA run with the same validity time...
Interval/period: N/A
Research analysis experiment produced with ECMWF IFS cycle 47R1, at TCo399 (25km), for the EUREC4A field campaign (15.01.2020-14.02.2020). The dropsondes and radiosondes launched in the campaign are denied from the data assimilation.
Examples
Interval/period: N/A