Datasets

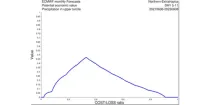
These charts show the probability of various mean periods of ocean waves 10-15 days ahead. The ...
Interval/period: N/A

The ECMWF seasonal forecasts (SEAS5) are produced every month with a 51-member ensemble at a ...
Interval/period: N/A
Interval/period: Fri, 12/01/2006 - Mon, 12/01/2025

50-member extended-range hindcasts (46 days) targeting 2018 stratospheric sudden warming. Two initialisation dates considered: 2018-01-27 and 2018-01-31. Resolution TCo639L137. CY47R3.
Examples
Interval/period: N/A
These diagrams show the evolution of regimes indicative of likely weather by week around ...
Interval/period: N/A
Interval/period: Thu, 10/18/2018 - Wed, 07/31/2019
It has been generated using the UERRA-HARMONIE system by combining model data with observations into a complete and consistent dataset using the laws of physics.
Interval/period: Thu, 10/18/2018 - Wed, 07/31/2019
UERRA-HARMONIE and MESCAN-SURFEX systems. Forecasts up to 30 hours initialised
from the analyses at 00 and 12 UTC are available only through the CDS-API (see Documentation).
UERRA-HARMONIE is a 3-dimensional variational data assimilation system,
while MESCAN-SURFEX is a complementary surface analysis system.
Using the Optimal Interpolation method, MESCAN provides the best estimate of daily accumulated precipitation
Interval/period: Thu, 10/18/2018 - Wed, 07/31/2019
combined with observations using the UERRA-HARMONIE system and MESCAN-SURFEX system.
UERRA-HARMONIE is a 3-dimensional data assimilation system, whereas
MESCAN-SURFEX is a complementary surface analysis system. In general, the
assimilation systems are able to estimate biases between observations and to
sift good-quality data from poor data. The laws of physics allow for estimates
Interval/period: Thu, 10/18/2018 - Wed, 07/31/2019

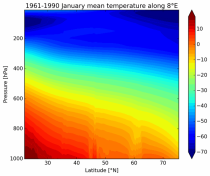
The objective of UERRA is to produce ensembles of European regional meteorological reanalyses of Essential Climate Variables (ECVs) for several decades and to estimate the associated uncertainties in the data sets. It also includes recovery of historical (last century) data. UERRA datasets come from 5 Numerical Weather Predication models: COSMO, HARMONIE, MESAN, MESCAN-SURFEX and UM/4DVAR.
Interval/period: N/A
Contains uncompressed IEEE-754 Standard (1985) 64-bit floating-point single-time atmospheric and wave model (long window 4Dvar) outputs for experiment version 'hplp'. Surface, and model and pressure levels are available for the atmospheric model.
Examples
retrieve, anoffset=9, class=rd, date=2020-07-21, expver=hplp, levtype=sfc, param=2t, step=24, stream=lwda, time=00:00:00, type=fc, target='output.grib'Get day-one forecast of 2 metre air temperature (single level)
Interval/period: N/A
Uncoupled ensemble subseasonal reforecasts (ENS-U) with ocean and sea ice boundary conditions derived from observed values at initialisation time. In these experiments, SSTs are specified using daily values from the Operational Sea Surface Temperature and Ice Analysisthat are persisted as anomalies on top of a daily mean SST climatology (1979-2001) derived from the ERA40 reanalysis.
Interval/period: N/A
Interval/period: Tue, 07/05/1994 - Sun, 02/28/2021
**Note:** In **June 2023** ECMWF implemented a **major upgrade ...**
Interval/period: N/A
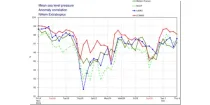
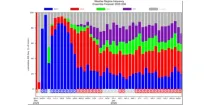
These diagrams compare recent ECMWF verification scores for Mean Sea Level Pressure with ...
Interval/period: N/A
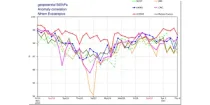
These diagrams compare recent ECMWF verification scores for 500 hPa height with those of other ...
Interval/period: N/A
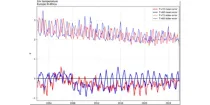
This diagram shows mean and standard deviation of errors in the HRES forecasts for several ...
Interval/period: N/A
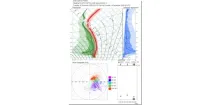
The Vertical Profiles display the vertical structure of the forecast model atmosphere in a familiar user friendly way. The vertical structure of temperatures (red) dewpoints (green) and dewpoint depressions (blue) from each ENS member ...
Interval/period: N/A
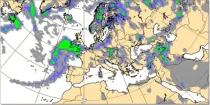
Predicting near surface visibility is dependent on predicting the correct dynamic and thermodynamic conditions in the boundary layer which can be highly variable. Fog is an extremely important weather hazard...
Interval/period: N/A
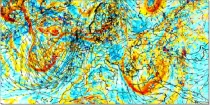
The movement or transfer of vorticity helps in the assessment of vertical motion of air (ascent) in the troposphere. Where a local vorticity maximum approaches an area there is a tendency for air to rise and where a local vorticity maximum moves ...
Interval/period: N/A
Vorticity is the tendency of an air particle to rotate or circulate around a particular point. Relative Vorticity is a measure about a vertical axis of the local rotation or spin of the air relative...
Interval/period: N/A
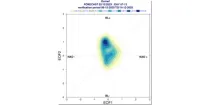
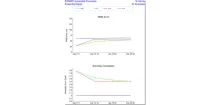
This diagram shows daily probabilities for four types of Euro-Atlantic weather regimes over ...
Interval/period: N/A
The DestinE Digital Twin for Weather-Induced Extremes (Extremes DT) supports responding and adapting to extreme events in a changing world by providing a capability to produce tailored simulations and address what-if scenarios related to extreme events in a past, present and future climate, complementing existing capabilities at national and European level.
Interval/period: N/A
**Note:** In **June 2023** ECMWF implemented a **major upgrade ...**
Interval/period: N/A