Datasets

Members 1-30 of PRIMAVERA (https://www.primavera-h2020.eu/) sensitivity experiment primWP5-coupledseaice. Configured as HighResMIP/CMIP6 ECMWF-IFS-LR experiment control-1950 ( https://doi.org/10.5194/gmd-11-3681-2018) but with sea-ice albedo set to open ocean values (i.e. 0.066). Each member is run for 15 months and initialized on January 1st by branching from years 1-30 of control-1950 (i.e. there is one year of separation in start dates for each member).
Interval/period: N/A
Members 31-40 of PRIMAVERA (https://www.primavera-h2020.eu/) sensitivity experiment primWP5-coupledseaice. Configured as HighResMIP/CMIP6 ECMWF-IFS-HR experiment control-1950 ( https://doi.org/10.5194/gmd-11-3681-2018) but with sea-ice albedo set to open ocean values (i.e. 0.066). Each member is run for 15 months and initialized on January 1st by branching from years 31-40 of control-1950 (i.e. there is one year of separation in start dates for each member).
Interval/period: N/A
Members 31-40 of PRIMAVERA (https://www.primavera-h2020.eu/) sensitivity experiment primWP5-coupledseaice. Configured as HighResMIP/CMIP6 ECMWF-IFS-LR experiment control-1950 ( https://doi.org/10.5194/gmd-11-3681-2018) but with sea-ice albedo set to open ocean values (i.e. 0.066). Each member is run for 15 months and initialized on January 1st by branching from years 31-40 of control-1950 (i.e. there is one year of separation in start dates for each member).
Interval/period: N/A
This chart shows probability information regarding 10 m wind gust derived from the ECMWF ...
Interval/period: N/A
These charts are derived from the ECMWF ensemble forecast (ENS) system and show probability of ...
Interval/period: N/A
This chart shows probability information regarding dew point temperature 2 m above the ground derived from the ECMWF ensemble (ENS) at the validity time...
Interval/period: N/A
These charts are derived from the ECMWF ensemble forecast (ENS) system and show probability of 2 ...
Interval/period: N/A
These charts are derived from the ECMWF ensemble forecast (ENS) system. They show probability ...
Interval/period: N/A
The CAT (Clear Air Turbulence) parameter is given in units of the turbulent Eddy Dissipation ...
Interval/period: N/A
This chart shows probability information regarding freezing rain derived from the ECMWF ensemble ...
Interval/period: N/A

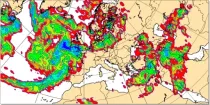
This chart shows probability information regarding lightning flash density derived from the ...
Interval/period: N/A
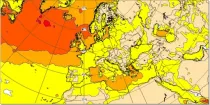
This chart shows probability information regarding maximum temperature 2 m above the ground derived from the ECMWF ensemble (ENS) during the 6 hour period preceding the validity time...
Interval/period: N/A

This chart shows probability information regarding mean wave period derived from the ECMWF ...
Interval/period: N/A
This chart shows probability information regarding minimum temperature 2 m above the ground derived from the ECMWF ensemble (ENS) during the 6 hour period preceding the validity time...
Interval/period: N/A
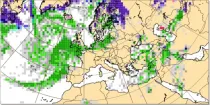
This chart shows probability information regarding precipitation type at the validity time ...
Interval/period: N/A
These charts show probabilities of multi-day precipitation accumulation. ...
Interval/period: N/A
This chart shows probability information regarding point precipitation, as derived from the ...
Interval/period: N/A
This chart shows probability information derived from the ECMWF ensemble (ENS) regarding large ...
Interval/period: N/A
This chart shows probability information derived from the ECMWF ensemble (ENS) regarding the ...
Interval/period: N/A

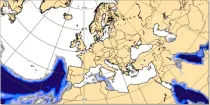
This chart shows probability information regarding significant wave height derived from the ...
Interval/period: N/A
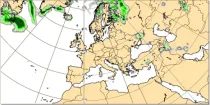
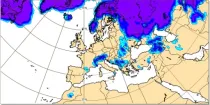
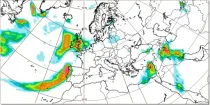
This chart shows probability information regarding snowfall derived from the ECMWF ensemble ...
Interval/period: N/A
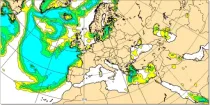
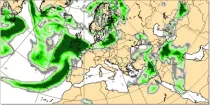
This chart shows probability information regarding total precipitation derived from the ECMWF ...
Interval/period: N/A

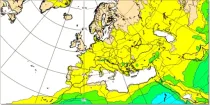
This chart shows probability information regarding visibility near the surface derived from the ...
Interval/period: N/A
This chart shows probability information regarding the maximum gust at 10 m above the earth's ...
Interval/period: N/A
This chart shows probability information regarding 24 hour total precipitation derived from the ...
Interval/period: N/A