Datasets
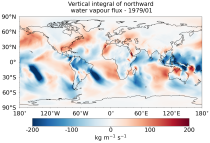
The vertically integrated budget diagnostics include the tendencies and lateral fluxes of total energy, water vapour, and latent heat (with the latent heat of vaporization varying with temperature). In addition, the divergences of the lateral fluxes are provided.
Interval/period: Mon, 01/01/1979 - Fri, 05/08/2026
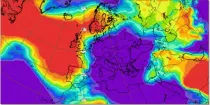
Maximum Wind gusts at 10 m above the earth's surface during the 6 hour period previous to the selected validity time are shown using colour shading. 10 m wind gusts are a post-processed product...
Interval/period: N/A
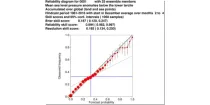
The reliability diagram shows the reliability of the ECMWF seasonal forecast system (SEAS5) with ...
Interval/period: N/A
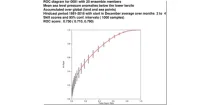
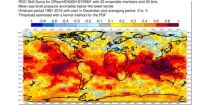
This chart shows the Relative Operating Characteristics (ROC) diagram for the three-month ...
Interval/period: N/A
This chart shows the spatial variation in the Relative Operating Characteristics (ROC) skill ...
Interval/period: N/A
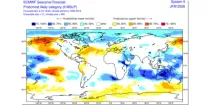
The ECMWF seasonal forecasts (SEAS5) are produced every month with a 51-member ensemble at a ...
Interval/period: N/A
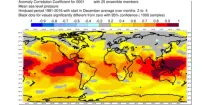
This chart shows the spatial variation in the Anomaly Correlation Coefficient (ACC) for the ...
Interval/period: N/A
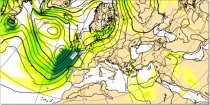
Wind speed at 200 hPa highlights the jet stream (areas of strong winds in the upper troposphere) which can help identify movement and development of depressions...
Interval/period: N/A
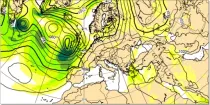
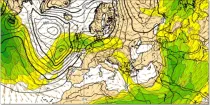
Wind speeds near the surface are roughly proportional to the distance between isobars so closely packed isobars mean strong surface winds...
Interval/period: N/A
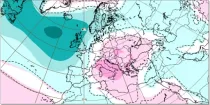
This chart shows probabilities for the 7-day mean anomalies of mean sea level pressure (mslp) to ...
Interval/period: N/A
This chart shows probabilities that the 7-day mean of mean sea level pressure (from the 101 ...
Interval/period: N/A
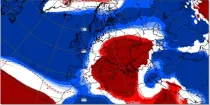
This chart shows 7-day mean anomalies of mean sea level pressure (mslp) from the ECMWF ...
Interval/period: N/A

Mean wave period is the spectrally averaged period of the waves. Wave periods are shown in seconds using colour shading – click on the middle icon to the bottom right for the scale...
Interval/period: N/A
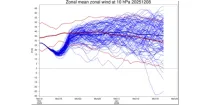
This shows the daily distribution and evolution of mean zonal wind at 10hPa at 60N or 60S. ...
Interval/period: N/A

Each country's experiments can be accessed via the links below:
Interval/period: N/A

SNAPSI case study of Northern Hemisphere strong polar vortex case in the stratosphere, initialised on 2022-01-01. TCo319L137 resolution 51-member ensemble, integrated for 70 days. Nudging to the zonal-mean.
Examples
Interval/period: N/A
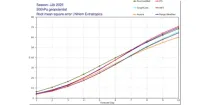
Scores of forecasts of surface parameters by experimental machine learning models
Interval/period: N/A
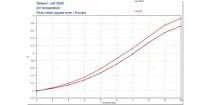
These plots compare recent IFS and experimental AIFS verification scores for 500 hPa ...
Interval/period: N/A
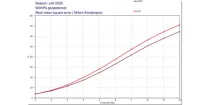
These plots compare recent IFS and experimental AIFS verification scores for 500 hPa ...
Interval/period: N/A
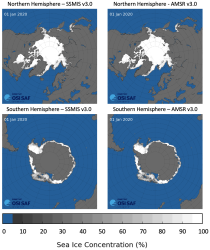
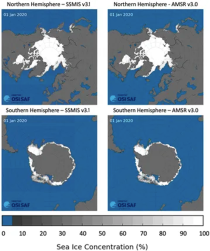
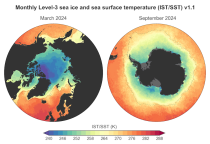
This dataset provides daily gridded data of sea ice concentration for both hemispheres derived from satellite passive microwave brightness temperatures. Sea ice is an important component of our climate system and a sensitive indicator of climate change. Its presence or its retreat has a strong impact on air-sea interactions, the Earth’s energy budget as well as marine ecosystems. It is listed as an Essential Climate Variable by the Global Climate Observing System.
Interval/period: N/A
Interval/period: Sun, 10/01/1978 - Mon, 09/29/2025
Interval/period: Tue, 01/01/1991 - Thu, 12/31/2020
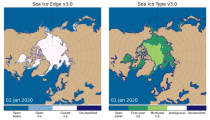
This dataset provides daily gridded data of sea ice edge and sea ice type derived from brightness temperatures measured by satellite passive microwave radiometers. Sea ice is an important component of our climate system and a sensitive indicator of climate change. Its presence or its retreat has a strong impact on air-sea interactions, the Earth’s energy budget as well as marine ecosystems. It is recognized by the Global Climate Observing System as an Essential Climate Variable. Sea ice edge and type are some of the parameters used to characterise sea ice.
Interval/period: N/A

Interval/period: Wed, 10/25/1978 - Wed, 09/24/2025
Interval/period: Mon, 01/01/1979 - Tue, 09/30/2025