Datasets
Interval/period: Wed, 01/01/1986 - Mon, 12/31/2085
Interval/period: Thu, 04/04/2002 - Tue, 04/01/2025

This dataset contains atmospheric mixing ratios of carbon dioxide (CO2), methane (CH4) and carbon monoxide (CO), CO2 and CH4 fluxes at the surface, CO2 tagged tracers to monitor the atmospheric enhancement associated with anthropogenic emissions and natural fluxes, and meteorological parameters from very high resolution (9km) global simulations with the Integrated Forecasting System of the European Weather Centre for Medium Range Weather Forecasts (ECMWF).
Interval/period: N/A
The dataset is organised around two main variables:
the mean radiant temperature (MRT)
the universal thermal climate index (UTCI)
Interval/period: Fri, 12/01/1939 - Sat, 05/02/2026
Interval/period: Mon, 01/01/1940 - Fri, 05/09/2025
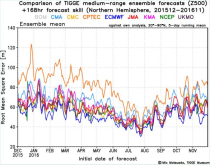
The dataset has been available since October 2006. TIGGE was established as a key component of THORPEX: a World Weather Research Programme to accelerate the improvements in the accuracy of 1-day to 2 week high-impact weather forecasts (THORPEX stands for THe Observing system Research and Predictability EXperiment)
Interval/period: Sun, 10/01/2006 - Wed, 05/06/2026
These diagrams compare scores of ensemble control (red) and ensemble members (central 50% of ...
Interval/period: N/A
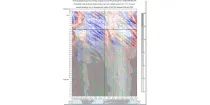
This is a time/longitude diagram (Hovmoller diagram) of 500 hPa or 1000 hPa mean height anomaly ...
Interval/period: N/A
The time-longitude diagram (Hovmoller diagram) shows a section of ensemble mean anomalies or ...
Interval/period: N/A
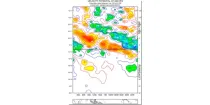
Total accumulated rainfall charts identify areas at greater risk of significant rainfall (or rain equivalent e.g.snowfall) but give no information regarding whether this occurs over a short or prolonged time period...
Interval/period: N/A

This display helps with the recognition of clouds of different layers, even when they overlap. Brighter colouring represents greater cloud cover. Cloud-free areas appear white while areas of full cloud cover at all levels appear dark grey (e.g. active fronts)...
Interval/period: N/A
The charts show the forecast value of the vertically integrated total column water (vapour + cloud water + cloud ice but with no precipitation included) in units of kg m⁻²...
Interval/period: N/A