
Datasets

IFS-COMPO Reference experiment for fire emission sensitivity evaluation. This experiment uses a CY50R1 esuite model configuration, but with updates to the isoprene degradation chemistry, along with a basic implementation of C2H2 chemistry, as planned for CY51R1. Otherwise, this experiment is run as a series of 24h forecasts excluding assimilation of atmospheric composition on T511 horizontal resolution. Default GFAS fire emissions are employed here.
Examples
Interval/period: N/A
IFS-COMPO Reference experiment for fire emission sensitivity evaluation. This experiment uses a CY50R1 esuite model configuration, but with updates to the isoprene degradation chemistry, along with a basic implementation of C2H2 chemistry, as planned for CY51R1. Otherwise, this experiment is run as a series of 24h forecasts excluding assimilation of atmospheric composition on T511 horizontal resolution. This experiment uses daily fire emissions from the FINN database.
Examples
Interval/period: N/A
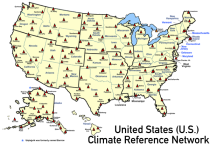
United States Climate Reference Network (USCRN) stations.
There are over 130 USCRN stations over the conterminous United States (U.S.), Alaska, and Hawaii.
The USCRN stations are managed and maintained by the U.S. National Oceanic and Atmospheric Administration (NOAA).
The USCRN observations include air temperature, humidity, wind speed, precipitation, solar radiation,
Interval/period: Sun, 01/01/2006 - Sun, 08/09/2026
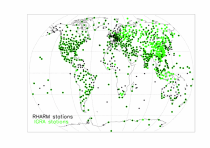
The first is version 2 of the Integrated Global Radiosounding Archive (IGRA) from 1978 which incorporates global
radiosounding profiles of temperature, humidity and wind from a large number of data sources,
which is 30% larger than the previous version 1. IGRA v2 is the result of quality assurance procedures applied to the
Interval/period: Sun, 01/01/1978 - Sun, 08/09/2026
Interval/period: Sun, 01/01/1978 - Wed, 10/17/2018
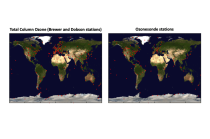
The total ozone estimates are based on solar UV radiation measurements made by ground-based spectrophotometers (Dobson or Brewer type spectrophotometers).
The vertical profiles of ozone concentration are estimated primarily using ozonesonde observations.
Data are available for 159 Dobson stations, 109 Brewer stations and 135 ozonesondes stations.
Interval/period: Tue, 01/01/1924 - Sun, 08/09/2026
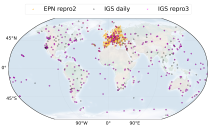
(GNSS) radio signals.
The initial data is collected from two in situ ground-based network of GNSS receivers – the International GNSS Service
(IGS) and EUREF Permanent Network (EPN). The IGS collects, archives, and freely distributes GNSS data from a
cooperatively operated global network of more than 500 ground-based GNSS stations since 1994. The EPN is a European
Interval/period: Mon, 01/01/1996 - Sun, 08/09/2026
Forecasts using IFS EPS CY47R2 replicating operations (51 members, TCo639, ORCA025Z75). The CO2 concentration was set to 615 ppm. If you are interested in using these data, please let us know by contacting nicholas.leach@physics.ox.ac.uk .
Examples
Interval/period: N/A
4-month long 101-ensemble member seasonal attribution experiment (IC98) initialised on 01-November-1997 using the atmosphere-only version of SEAS5 (see Johnson et al., 2019) forced with daily ERA5 SST as in the reference experiment (R98) but with daily SST climatology over the tropical Indian Ocean.
Examples
Interval/period: N/A
4-month long 101-ensemble member seasonal attribution experiment (IC16) initialised on 01-November-2015 using the atmosphere-only version of SEAS5 (see Johnson et al., 2019) forced with daily ERA5 SST as in the reference experiment (R16) but with daily SST climatology over the tropical Indian Ocean.
Examples
Interval/period: N/A
4-month long 101-ensemble member seasonal attribution experiment (IC20) initialised on 01-November-2019 using the atmosphere-only version of SEAS5 (see Johnson et al., 2019) forced with daily ERA5 SST as in the reference experiment (R20) but with daily SST climatology over the tropical Indian Ocean.
Examples
Interval/period: N/A
This experiment is a prototype. It has several important limitations. It is not an ERA6 production. It has known missing components. It should not be used for any application or publication. It should be used to provide feedback to ECMWF.
Examples
Interval/period: N/A
This experiment is a prototype. It has several important limitations. It is not an ERA6 production. It has known missing components. It should not be used for any application or publication. It should be used to provide feedback to ECMWF.
Examples
Interval/period: N/A
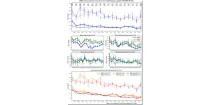
The diagram shows mean errors in position and intensity of tropical cyclones for HRES and ENS. ...
Interval/period: N/A
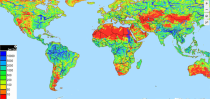
The data are bias adjusted using the Distribution Based Scaling (DBS) method versus the global reference dataset HydroGFD2.0, both bias adjustment method and global reference dataset developed by the Swedish Meteorological and Hydrological Institute (SMHI).
The DBS method is a parametric quantile-mapping variant.
Interval/period: Thu, 10/12/2000 - Thu, 10/18/2018
This is a 4 month seasonal hindcast experiment with CY49R1 at TCo199 initialised from an open loop land-surface analysis (as in iwvp) except that over Eurasia values are replaced with climatological values for the initial day (calculated from the open loop the period 1993-2022)
Examples
Interval/period: N/A
This is a 4 month seasonal hindcast experiment with CY49R1 at TCo199 initialised from an open loop land-surface analysis (as in iwvp) except that over North America values are replaced with climatological values for the initial day (calculated from the open loop the period 1993-2022)
Examples
Interval/period: N/A
Coupled ensemble forecasts (60 days, 8+1 members), 1 Jan 1981-2016, IFS-CY43R3 TCo319L91, no initial perturbations, SPPT applied only in (50E-120E, 20N-20S). Twice-daily global pressure-level gridded F80 atmospheric fields.
Examples
Interval/period: N/A
Coupled ensemble forecasts (60 days, 50+1 members), 1 Jan 1987,1990,1995,2010,2013, IFS-CY43R3 TCo319L91, no initial perturbations, SPPT applied only in (50E-120E, 20N-20S). Twice-daily global pressure-level gridded F80 atmospheric fields.
Examples
Interval/period: N/A
Coupled ensemble forecasts (60 days, 8+1 members), 1 Nov 1981-2016, IFS-CY43R3 TCo319L91, no initial perturbations, SPPT applied only in (50E-120E, 20N-20S). Twice-daily global pressure-level gridded F80 atmospheric fields.
Examples
Interval/period: N/A
Coupled ensemble forecasts (60 days, 50+1 members), 1 Nov 2002, IFS-CY43R3 TCo319L91, no initial perturbations, SPPT applied only in (50E-120E, 20N-20S). Twice-daily global pressure-level gridded F80 atmospheric fields.
Examples
Interval/period: N/A
Interval/period: Sun, 01/01/1950 - Tue, 12/31/2019
Interval/period: Mon, 01/01/2001 - Fri, 04/01/2022
Interval/period: N/A