
Datasets
Interval/period: Wed, 01/01/1975 - Tue, 08/11/2026
**Note:** In **June 2023** ECMWF implemented a **major upgrade ...**
Interval/period: N/A
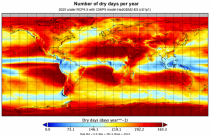
Interval/period: Sun, 01/01/1950 - Thu, 12/31/2099
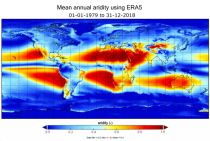
Interval/period: Mon, 01/01/1979 - Mon, 12/31/2018
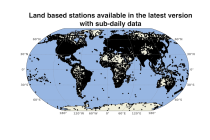
Interval/period: Sat, 01/01/1718 - Thu, 02/26/2026
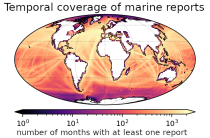
and naval ships, drifting buoys and other platforms and vessels over
the global ocean. Data have been collated and harmonised and quality control checks have been performed, but no attempt
has been made to assess or correct for potential biases.
Data are provided for a range of commonly observed variables.
Interval/period: Tue, 01/01/1850 - Tue, 08/11/2026
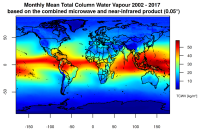
This catalogue entry presents two extensive, high-quality observational datasets of TCWV, specifically tailored for climate analysis and applications.
Interval/period: Tue, 01/01/2002 - Sun, 12/31/2017

Long-range reforecast experiment covering the period 1901-2010 with a low-resolution configuration of SEAS5 To explore ENSO predictability up to 2 years. The reforecasts are initialised with the coupled reanalysis of the 20th Century CERA-20C.
Examples
Interval/period: N/A
Long-range ensemble forecast experiment initialised on 1st May 2022 covering the 4 months up to the end of August 2022 with atmospheric CO2 concentrations reduced to pre-industrial levels of 285 ppm
Examples
Interval/period: N/A
Global relaxation experiment run at Tco199 for 46 days over 20 years starting on 12, 16 , 19, 23, 26 , 30 December and 2nd, 6th and 9th January 1999-2018.
Examples
retrieve, class=rd, stream=enfh, expver=iknn, type=pf, number=1/to/4, levtype=sfc, param=2t, date=20191212, hdate=20091212, time=00:00:00, step=24, target='output.grib'Retrieving 2-meter temperature of the hindcast starting on 12 December 2019 for all perturbed members.
Interval/period: N/A
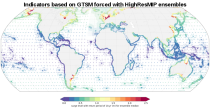
Interval/period: Mon, 01/01/1951 - Sat, 12/31/2050
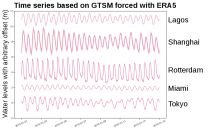
Interval/period: Sun, 01/01/1950 - Sat, 12/31/2050
TCo399 experiment denying the assimilation of GNSS-RO observations between 20201001-20210430.
Examples
retrieve, anoffset=12, class=rd, date=2020-10-01/to/2021-04-30, expver=ibx8, levelist=1/2/3/5/7/10/20/30/50/70/100/150/200/250/300/400/500/600/700/800/850/900/925/950/1000, levtype=pl, param=129.128, step=0, stream=lwda, time=09:00:00/21:00:00, type=4v, target="output"Retrieve geopotential analysis fields on pressure levels
Interval/period: N/A
TCo399 experiment denying the assimilation of GNSS-RO observations between 20211001-20220430.
Examples
retrieve, anoffset=12, class=rd, date=2021-10-01/to/2022-04-30, expver=ibyo, levelist=1/2/3/5/7/10/20/30/50/70/100/150/200/250/300/400/500/600/700/800/850/900/925/950/1000, levtype=pl, param=129.128, step=0, stream=lwda, time=09:00:00/21:00:00, type=4v, target="output"Retrieve geopotential analysis fields on pressure levels
Interval/period: N/A
TCo399 experiment denying the assimilation of GNSS-RO observations between 20221001-20230430.
Examples
retrieve, anoffset=12, class=rd, date=2022-10-01/to/2023-04-30, expver=ic2g, levelist=1/2/3/5/7/10/20/30/50/70/100/150/200/250/300/400/500/600/700/800/850/900/925/950/1000, levtype=pl, param=129.128, step=0, stream=lwda, time=09:00:00/21:00:00, type=4v, target="output"Retrieve geopotential analysis fields on pressure levels
Interval/period: N/A
TCo399 experiment denying the assimilation of GNSS-RO observations between 20231001-20240430.
Examples
retrieve, anoffset=12, class=rd, date=2023-10-01/to/2024-04-30, expver=ic0t, levelist=1/2/3/5/7/10/20/30/50/70/100/150/200/250/300/400/500/600/700/800/850/900/925/950/1000, levtype=pl, param=129.128, step=0, stream=lwda, time=09:00:00/21:00:00, type=4v, target="output"Retrieve geopotential analysis fields on pressure levels
Interval/period: N/A
TCo399 experiment assimilating GNSS-RO observations between 20201001-20210430.
Examples
retrieve, anoffset=12, class=rd, date=2020-10-01/to/2021-04-30, expver=ibwq, levelist=1/2/3/5/7/10/20/30/50/70/100/150/200/250/300/400/500/600/700/800/850/900/925/950/1000, levtype=pl, param=129.128, step=0, stream=lwda, time=09:00:00/21:00:00, type=4v, target="output"Retrieve geopotential analysis fields on pressure levels
Interval/period: N/A
TCo399 experiment assimilating GNSS-RO observations between 20211001-20220430.
Examples
retrieve, anoffset=12, class=rd, date=2021-10-01/to/2022-04-30, expver=ibyp, levelist=1/2/3/5/7/10/20/30/50/70/100/150/200/250/300/400/500/600/700/800/850/900/925/950/1000, levtype=pl, param=129.128, step=0, stream=lwda, time=09:00:00/21:00:00, type=4v, target="output"Retrieve geopotential analysis fields on pressure levels
Interval/period: N/A
TCo399 experiment assimilating GNSS-RO observations between 20221001-20230430.
Examples
retrieve, anoffset=12, class=rd, date=2022-10-01/to/2023-04-30, expver=ic0u, levelist=1/2/3/5/7/10/20/30/50/70/100/150/200/250/300/400/500/600/700/800/850/900/925/950/1000, levtype=pl, param=129.128, step=0, stream=lwda, time=09:00:00/21:00:00, type=4v, target="output"Retrieve geopotential analysis fields on pressure levels
Interval/period: N/A
TCo399 experiment assimilating GNSS-RO observations between 20231001-20240430.
Examples
retrieve, anoffset=12, class=rd, date=2023-10-01/to/2024-04-30, expver=ic2f, levelist=1/2/3/5/7/10/20/30/50/70/100/150/200/250/300/400/500/600/700/800/850/900/925/950/1000, levtype=pl, param=129.128, step=0, stream=lwda, time=09:00:00/21:00:00, type=4v, target="output"Retrieve geopotential analysis fields on pressure levels
Interval/period: N/A
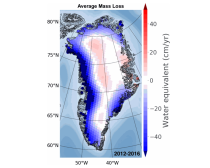
Interval/period: Wed, 01/01/2003 - Sat, 12/31/2022
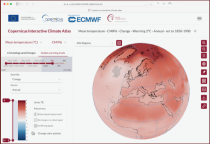
Interval/period: Sun, 01/01/1860 - Mon, 12/31/2300
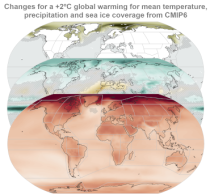
Interval/period: Sun, 01/01/1860 - Mon, 12/31/2300
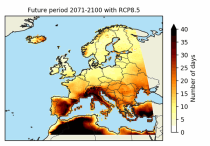
These heat wave and cold spell days are available for different future time periods and use different climate change scenarios.
Interval/period: Wed, 01/01/1986 - Mon, 12/31/2085
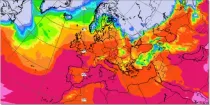
These charts represent the height of the air temperature 0°C isotherm or the Wet bulb temperature 0°C isotherm...
Interval/period: N/A