
Datasets

Interval/period: N/A
Interval/period: N/A
Interval/period: N/A
Interval/period: N/A
Interval/period: N/A
Interval/period: N/A
Interval/period: N/A
Interval/period: N/A
Interval/period: N/A
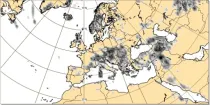
This chart shows probability information regarding visibility near the surface derived from the ...
Interval/period: N/A
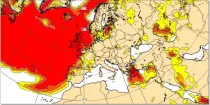
This chart shows probability information regarding the maximum gust at 10 m above the earth's ...
Interval/period: N/A
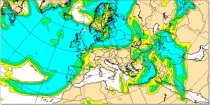
This chart shows probability information regarding 24 hour total precipitation derived from the ...
Interval/period: N/A
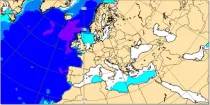
These charts show the probability of various mean periods of ocean waves 10-15 days ahead. The ...
Interval/period: N/A
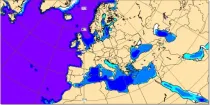
These charts show probability of various heights of significant waves 10-15 days ahead. The ...
Interval/period: N/A
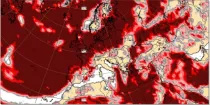
This chart shows probability information regarding wind speeds at 100 m above the earth's ...
Interval/period: N/A
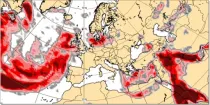
This chart shows probability information regarding CAPE shear derived from the ECMWF ensemble ...
Interval/period: N/A
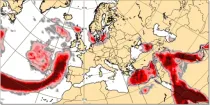
This chart shows probability information regarding MUCAPE derived from the ECMWF ensemble (ENS) ...
Interval/period: N/A
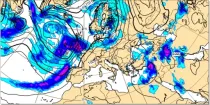
Precipitation totals include all precipitation types (rain, snow etc.) (in mm of rainfall or rainfall equivalent) falling in 6 hour or 12 hour periods using colour shading...
Interval/period: N/A
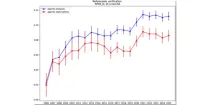
This diagram gives a measure of the effectiveness of the model. ...
Interval/period: N/A

Research analysis experiment produced with ECMWF IFS cycle 47R1, at TCo399 (25km), for the EUREC4A field campaign (15.01.2020-14.02.2020). As in the operational analysis, the radiosondes and dropsondes launched in the campaign are assimilated.
Examples
Interval/period: N/A
4-month long 101-ensemble member seasonal reference experiment (R98) initialised on 01-November-1997 using the atmosphere-only version of SEAS5 (see Johnson et al., 2019) forced with daily ERA5 SST.
Examples
retrieve, class=rd, date=1997-11-01, expver=hosm, fcmonth=1/2/3/4, levtype=pl, levelist=500, method=1, number=0/to/100, origin=ecmf, param=z, stream=msmm, system=5, time=00:00:00, type=fcmean, target="output_z500.grib"Monthly mean Geopotential at 500 hPa
Interval/period: N/A
4-month long 101-ensemble member seasonal reference experiment (R16) initialised on 01-November-2015 using the atmosphere-only version of SEAS5 (see Johnson et al., 2019) forced with daily ERA5 SST.
Examples
retrieve, class=rd, date=2015-11-01, expver=hosn, fcmonth=1/2/3/4, levtype=pl, levelist=500, method=1, number=0/to/100, origin=ecmf, param=z, stream=msmm, system=5, time=00:00:00, type=fcmean, target="output_z500.grib"Monthly mean Geopotential at 500 hPa
Interval/period: N/A
4-month long 101-ensemble member seasonal reference experiment (R20) initialised on 01-November-2019 using the atmosphere-only version of SEAS5 (see Johnson et al., 2019) forced with daily ERA5 SST.
Examples
retrieve, class=rd, date=2019-11-01, expver=hosi, fcmonth=1/2/3/4, levtype=pl, levelist=500, method=1, number=0/to/100, origin=ecmf, param=z, stream=msmm, system=5, time=00:00:00, type=fcmean, target="output_z500.grib"Monthly mean Geopotential at 500 hPa
Interval/period: N/A
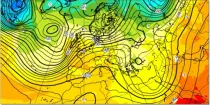
The 850 hPa level is usually just above the boundary layer and at this level the day-night variation in temperature is generally negligible...
Interval/period: N/A
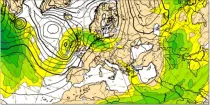
Wind speed at 200 hPa highlights the jet stream (areas of strong winds in the upper troposphere) which can help identify movement and development of depressions...
Interval/period: N/A