Datasets
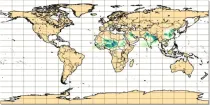

Polar relaxation experiment run at Tco199 for 46 days over 20 years starting on 12, 16 , 19, 23, 26 , 30 December and 2nd, 6th and 9th January 1999-2018.
Examples
retrieve, class=rd, stream=enfh, expver=iknn, type=pf, number=1/to/4, levtype=sfc, param=2t, date=20191212, hdate=20091212, time=00:00:00, step=24, target='output.grib'Retrieving 2-meter temperature of the hindcast starting on 12 December 2019 for all perturbed members.
Interval/period: N/A
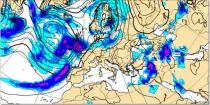
These charts show MSLP and 850hPa forecasts for the Ensemble Control Forecast, and 50 ENS ...
Interval/period: N/A
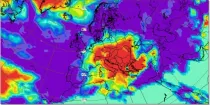
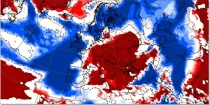
Potential vorticity (PV) helps description and understanding of dynamic processes in the atmosphere by giving an indication of ascending or descending air flows and the development or weakening of ...
Interval/period: N/A
Forecasts using IFS EPS CY47R2 replicating operations (51 members, TCo639, ORCA025Z75). The CO2 concentration was set to 285 ppm. If you are interested in using these data, please let us know by contacting nicholas.leach@physics.ox.ac.uk .
Examples
Interval/period: N/A
Forecasts using IFS EPS CY47R3 replicating operations (51 members, TCo639, ORCA025Z75). The ocean state has had a hydrostatically balanced estimate of anthropogenic influence (warming) since 1850-1900 removed. The CO2 concentration was set to 285 ppm.
Interval/period: N/A
Forecasts using IFS EPS CY47R2 replicating operations (51 members, TCo639, ORCA025Z75). The ocean state has had a hydrostatically balanced estimate of anthropogenic influence (warming) since 1850-1900 removed. The CO2 concentration was set to 285 ppm If you are interested in using these data, please let us know by contacting nicholas.leach@physics.ox.ac.uk .
Examples
Interval/period: N/A
Forecasts using IFS EPS CY47R2 replicating operations (51 members, TCo639, ORCA025Z75). The ocean state has had a hydrostatically balanced estimate of anthropogenic influence (warming) within the CMCC-CM2-HR4 climate model since 1850-1900 removed. The CO2 concentration was set to 285 ppm. If you are interested in using these data, please let us know by contacting nicholas.leach@physics.ox.ac.uk .
Examples
Interval/period: N/A
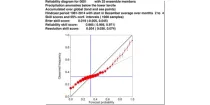
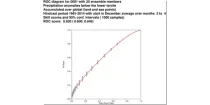
The reliability diagram shows the reliability of the ECMWF seasonal forecast system (SEAS5) with ...
Interval/period: N/A
This chart shows the Relative Operating Characteristics (ROC) diagram for the three-month ...
Interval/period: N/A
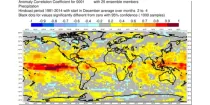
This chart shows the spatial variation in the Relative Operating Characteristics (ROC) skill ...
Interval/period: N/A
The ECMWF seasonal forecasts (SEAS5) are produced every month with a 51-member ensemble at a ...
Interval/period: N/A
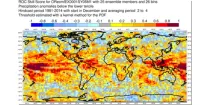
This chart shows the spatial variation in the Anomaly Correlation Coefficient (ACC) for the ...
Interval/period: N/A
The ECMWF seasonal forecasts (SEAS5) are produced every month with a 51-member ensemble at ...
Interval/period: N/A
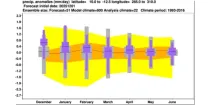
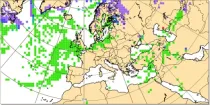
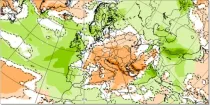
The charts show totals of large scale precipitation, convective precipitation, and the total of precipitation during the 6 hour period previous to the selected validity time...
Interval/period: N/A
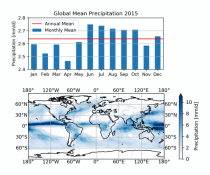
Interval/period: Mon, 01/01/1979 - Mon, 09/30/2024
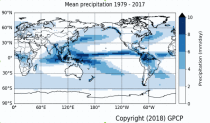
Interval/period: Sat, 01/01/2000 - Sun, 12/31/2017
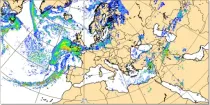
These charts show the rate of fall of large scale precipitation, the rate of fall of convective precipitation, the rate of fall of snowfall, or the rate of fall of all precipitation...
Interval/period: N/A
Where precipitation is forecast, a type of precipitation can be assigned according to the temperature structure of the model atmosphere that includes the layers through which the model precipitation falls...
Interval/period: N/A
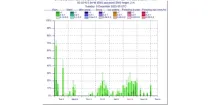
This product is derived from an ensemble of 50 model runs plus Control. The chart shows ...
Interval/period: N/A
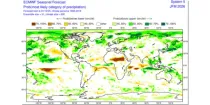
This chart shows probabilities for the 7-day mean anomalies of precipitation to be in defined ...
Interval/period: N/A
This chart shows probabilities that 7-day-total precipitation (from the 101 forecast members) ...
Interval/period: N/A
This chart shows 7-day mean anomalies of precipitation accumulation amounts from the ECMWF ...
Interval/period: N/A

A set of experiments from four centres: ECMWF, Météo-France, EDF and Met Office. The experiments are 120 day runs from 9 consecutive starting days, with write-ups every 24 hours of Pressure level and Surface data.
Interval/period: N/A
Members 1-30 of PRIMAVERA (https://www.primavera-h2020.eu/) sensitivity experiment primWP5-coupledseaice. Configured as HighResMIP/CMIP6 ECMWF-IFS-HR experiment control-1950 ( https://doi.org/10.5194/gmd-11-3681-2018) but with sea-ice albedo set to open ocean values (i.e. 0.066). Each member is run for 15 months and initialized on January 1st by branching from years 1-30 of control-1950 (i.e. there is one year of separation in start dates for each member).
Interval/period: N/A