Datasets
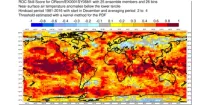
This chart shows the spatial variation in the Relative Operating Characteristics (ROC) skill ...
Interval/period: N/A
The ECMWF seasonal forecasts (SEAS5) are produced every month with a 51-member ensemble at a ...
Interval/period: N/A

Four-month 15-member ensemble hind-casts initialised on 1st of October 1992-2020. Fully radiatively interactive ozone. produced by the hybrid linear ozone scheme. IFS cycle 47r1 used. Output for pressure-level and surface fields is 6-hourly.
Examples
Interval/period: N/A
Four-month 15-member ensemble hind-casts initialised on 1st of October 1992-2020. Ozone monthly-mean zonal-mean climatology used in radiation. IFS cycle 47r1 used. Output for pressure-level and surface fields is 6-hourly.
Examples
Interval/period: N/A
This experiment contains 20 years of re-forecasts with 9 start dates twice a week between 12 December and 12 January of the following year. ensemble size is 11 members.
Examples
Interval/period: N/A
This experiment contains 20 years of re-forecasts with 9 start dates twice a week between 12 December and 12 January of the following year. ensemble size is 11 members.
Examples
Interval/period: N/A
This experiment contains 20 years of re-forecasts with 9 start dates twice a week between 12 December and 12 January of the following year. ensemble size is 11 members.
Examples
Interval/period: N/A
This experiment contains 20 years of re-forecasts with 9 start dates twice a week between 12 December and 12 January of the following year. ensemble size is 11 members.
Examples
Interval/period: N/A
This experiment contains 20 years of re-forecasts with 9 start dates twice a week between 12 December and 12 January of the following year. ensemble size is 11 members.
Examples
Interval/period: N/A
This experiment contains 20 years of re-forecasts with 9 start dates twice a week between 12 December and 12 January of the following year. ensemble size is 11 members.
Examples
Interval/period: N/A
This experiment contains 20 years of re-forecasts with 9 start dates twice a week between 12 December and 12 January of the following year. ensemble size is 11 members.
Examples
Interval/period: N/A
This experiment contains 20 years of re-forecasts with 9 start dates twice a week between 12 December and 12 January of the following year. ensemble size is 11 members.
Examples
Interval/period: N/A
This experiment contains 20 years of re-forecasts with 9 start dates twice a week between 12 December and 12 January of the following year. ensemble size is 11 members.
Examples
Interval/period: N/A
This experiment contains 20 years of re-forecasts with 9 start dates twice a week between 12 December and 12 January of the following year. ensemble size is 11 members.
Examples
Interval/period: N/A
This experiment contains 20 years of re-forecasts with 9 start dates twice a week between 12 December and 12 January of the following year. ensemble size is 11 members.
Examples
Interval/period: N/A
This experiment contains 20 years of re-forecasts with 9 start dates twice a week between 12 December and 12 January of the following year. ensemble size is 11 members.
Examples
Interval/period: N/A
This experiment contains 20 years of re-forecasts with 9 start dates twice a week between 12 December and 12 January of the following year. ensemble size is 11 members.
Examples
Interval/period: N/A
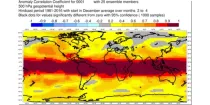
This chart shows the spatial variation in the Anomaly Correlation Coefficient (ACC) for the ...
Interval/period: N/A
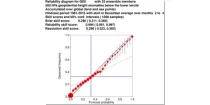
The reliability diagram shows the reliability of the ECMWF seasonal forecast system (SEAS5) with ...
Interval/period: N/A
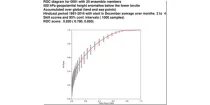
This chart shows the Relative Operating Characteristics (ROC) diagram for the three-month ...
Interval/period: N/A
This chart shows the spatial variation in the Relative Operating Characteristics (ROC) skill ...
Interval/period: N/A

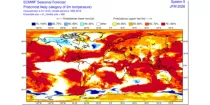
The ECMWF seasonal forecasts (SEAS5) are produced every month with a 51-member ensemble at a ...
Interval/period: N/A

The 850 hPa level is usually just above the boundary layer and at this level the day-night variation in temperature is generally negligible...
Interval/period: N/A

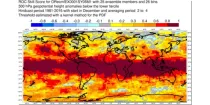
This chart shows 7-day mean anomalies of 500hPa geopotential height from the ECMWF Sub-seasonal ...
Interval/period: N/A

500-1000 hPa thickness is a measure of the mean temperature of a column of the atmosphere between these pressure levels and can be used to distinguish between warm and cold air masses and...
Interval/period: N/A