Datasets

A subset of ECMWF real-time forecast data from the IFS and AIFS models is made available to the public free of charge. Their use is governed by the Creative Commons CC-BY-4.0 licence and the ECMWF Terms of Use.
Interval/period: N/A
Single prediction that uses
observations prior information about the Earth-system ECMWF's highest-resolution modelHRES Direct model output Products offers "High Frequency products"
Interval/period: N/A
A vast amount of data is archived daily containing IFS (Integrated Forecast System) experiments produced by ECMWF's Research Department or by Member States' users at ECMWF. Basically, an experiment can address any area of meteorology and it is archived accordingly. Users wanting to retrieve Research experiments need to know in advance the name of the specific experiment and its nature. For this information please, contact User Support.
Interval/period: N/A
The Copernicus Climate Change Service (C3S) seasonal forecast service is based on data from several state-of-the-art seasonal prediction systems.
Interval/period: N/A
This product shows ENS meteograms from next model version of IFS cycle 50R1 that is planned to be ...
Interval/period: N/A
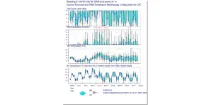
**This product shows ENS meteograms from next model version of IFS cycle 50R1 that is planned ...**
Interval/period: N/A
**Next IFS version (cycle 50r1)**. This product shows the probability of visibility (%) in 2 ...
Interval/period: N/A
(Next IFS version - CY50R1) Probability of precipitation type (%) in precipitation rate categories ...
Interval/period: N/A
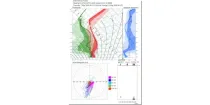
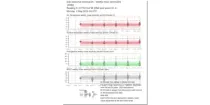
(New IFS cycle 50R1) The Vertical Profiles display the vertical structure of the forecast model atmosphere in a familiar user friendly way. The vertical structure of temperatures (red) dewpoints (green) and dewpoint depressions (blue) from each ENS member ...
Interval/period: N/A
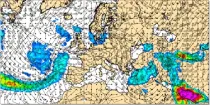
Bulk Wind Shearcharts show the vector value (in wind arrow form) of the shear between the low level, near surface level (10 m) and a mid-tropospheric level (about 6 km)...
Interval/period: N/A
The surface wind is influenced by the roughness of the earth's surface and is likely to be less strong, and a little backed (in the northern hemisphere) or veered (in the southern hemisphere)...
Interval/period: N/A
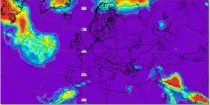
This chart shows the anomaly in the wind speed at 10 m above the earth's surface (in m/s) ...
Interval/period: N/A
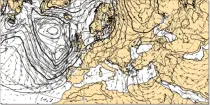
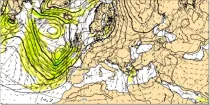
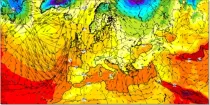
These charts show surface pressure patterns. Areas of high pressure (anticyclones) are usually associated with settled weather...
Interval/period: N/A
This chart shows 7-day mean anomalies of temperature at 10hPa from the ECMWF Sub-seasonal range ...
Interval/period: N/A
Dew Point Temperature at 2 m above the earth’s surface gives an indication of conditions which a person will experience or feel. High dewpoint temperatures inhibit heat loss from the body by perspriation and...
Interval/period: N/A
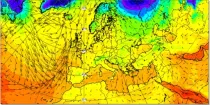
Temperatures at 2 m above the earth’s surface and winds at 10 m above the earth’s surface approximate most closely to the conditions that a person would experience.
Interval/period: N/A
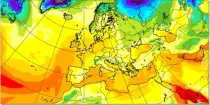
Air temperatures at 2 m above the earth's surface approximate most closely to the conditions a person would most likely experience...
Interval/period: N/A
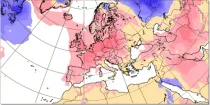
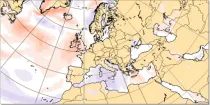
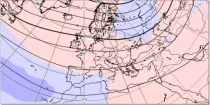
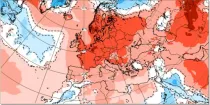
This chart shows the anomaly in the temperature at 2 m above the earth’s surface (in °C) during a 24 hour period immediately preceding the chosen valid date/time...
Interval/period: N/A
This chart shows probabilities for the 7-day mean anomalies of 2 m air temperature to be in ...
Interval/period: N/A
This chart shows probabilities that 7-day mean 2 m air temperatures (from the 101 forecast ...
Interval/period: N/A
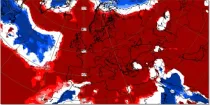
This chart shows 7-day mean anomalies of 2m air temperature from the ECMWF Sub-seasonal range ...
Interval/period: N/A
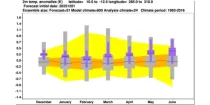
The ECMWF seasonal forecasts (SEAS5) are produced every month with a 51-member ensemble at ...
Interval/period: N/A
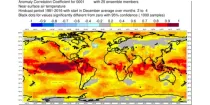
This chart shows the spatial variation in the Anomaly Correlation Coefficient (ACC) for the ...
Interval/period: N/A
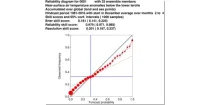
The reliability diagram shows the reliability of the ECMWF seasonal forecast system (SEAS5) with ...
Interval/period: N/A
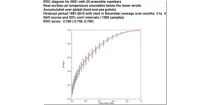
This chart shows the Relative Operating Characteristics (ROC) diagram for the three-month ...
Interval/period: N/A