Datasets
This product shows ENS meteograms from next model version of IFS cycle 50R1 that is planned to be ...
Interval/period: N/A
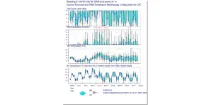
**This product shows ENS meteograms from next model version of IFS cycle 50R1 that is planned ...**
Interval/period: N/A
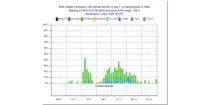
**Next IFS version (cycle 50r1)**. This product shows the probability of visibility (%) in 2 ...
Interval/period: N/A
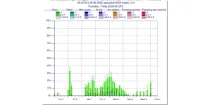
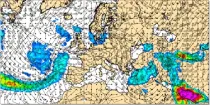
(Next IFS version - CY50R1) Probability of precipitation type (%) in precipitation rate categories ...
Interval/period: N/A
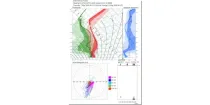
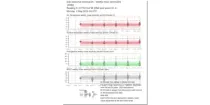
(New IFS cycle 50R1) The Vertical Profiles display the vertical structure of the forecast model atmosphere in a familiar user friendly way. The vertical structure of temperatures (red) dewpoints (green) and dewpoint depressions (blue) from each ENS member ...
Interval/period: N/A
Bulk Wind Shearcharts show the vector value (in wind arrow form) of the shear between the low level, near surface level (10 m) and a mid-tropospheric level (about 6 km)...
Interval/period: N/A
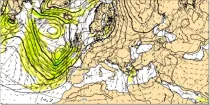
The surface wind is influenced by the roughness of the earth's surface and is likely to be less strong, and a little backed (in the northern hemisphere) or veered (in the southern hemisphere)...
Interval/period: N/A
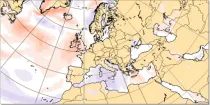
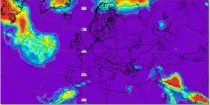
This chart shows the anomaly in the wind speed at 10 m above the earth's surface (in m/s) ...
Interval/period: N/A
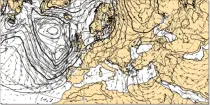
These charts show surface pressure patterns. Areas of high pressure (anticyclones) are usually associated with settled weather...
Interval/period: N/A
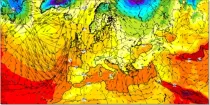
Dew Point Temperature at 2 m above the earth’s surface gives an indication of conditions which a person will experience or feel. High dewpoint temperatures inhibit heat loss from the body by perspriation and...
Interval/period: N/A
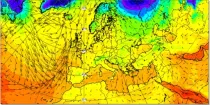
Temperatures at 2 m above the earth’s surface and winds at 10 m above the earth’s surface approximate most closely to the conditions that a person would experience.
Interval/period: N/A
Air temperatures at 2 m above the earth's surface approximate most closely to the conditions a person would most likely experience...
Interval/period: N/A
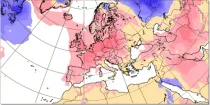
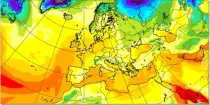
This chart shows the anomaly in the temperature at 2 m above the earth’s surface (in °C) during a 24 hour period immediately preceding the chosen valid date/time...
Interval/period: N/A
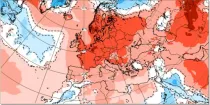
This chart shows probabilities for the 7-day mean anomalies of 2 m air temperature to be in ...
Interval/period: N/A
This chart shows probabilities that 7-day mean 2 m air temperatures (from the 101 forecast ...
Interval/period: N/A
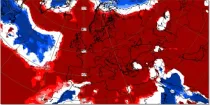
This chart shows 7-day mean anomalies of 2m air temperature from the ECMWF Sub-seasonal range ...
Interval/period: N/A
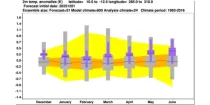
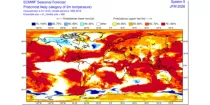
The ECMWF seasonal forecasts (SEAS5) are produced every month with a 51-member ensemble at ...
Interval/period: N/A
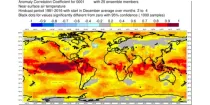
This chart shows the spatial variation in the Anomaly Correlation Coefficient (ACC) for the ...
Interval/period: N/A
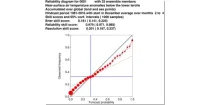
The reliability diagram shows the reliability of the ECMWF seasonal forecast system (SEAS5) with ...
Interval/period: N/A
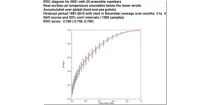
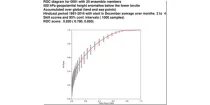
This chart shows the Relative Operating Characteristics (ROC) diagram for the three-month ...
Interval/period: N/A
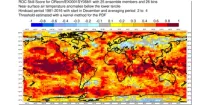
This chart shows the spatial variation in the Relative Operating Characteristics (ROC) skill ...
Interval/period: N/A
The ECMWF seasonal forecasts (SEAS5) are produced every month with a 51-member ensemble at a ...
Interval/period: N/A
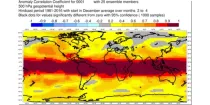
This chart shows the spatial variation in the Anomaly Correlation Coefficient (ACC) for the ...
Interval/period: N/A
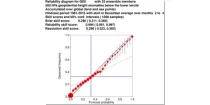
The reliability diagram shows the reliability of the ECMWF seasonal forecast system (SEAS5) with ...
Interval/period: N/A
This chart shows the Relative Operating Characteristics (ROC) diagram for the three-month ...
Interval/period: N/A