Datasets
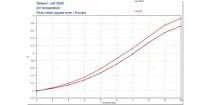
Scores of forecasts of surface parameters by experimental machine learning models
Interval/period: N/A
These plots compare recent IFS and experimental AIFS verification scores for 500 hPa ...
Interval/period: N/A
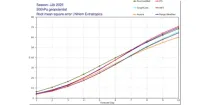
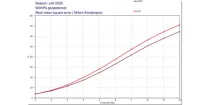
These plots compare recent IFS and experimental AIFS verification scores for 500 hPa ...
Interval/period: N/A
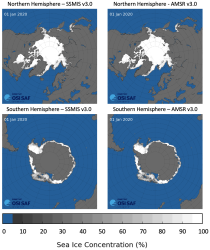
This dataset provides daily gridded data of sea ice concentration for both hemispheres derived from satellite passive microwave brightness temperatures. Sea ice is an important component of our climate system and a sensitive indicator of climate change. Its presence or its retreat has a strong impact on air-sea interactions, the Earth’s energy budget as well as marine ecosystems. It is listed as an Essential Climate Variable by the Global Climate Observing System.
Interval/period: N/A
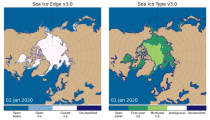
This dataset provides daily gridded data of sea ice edge and sea ice type derived from brightness temperatures measured by satellite passive microwave radiometers. Sea ice is an important component of our climate system and a sensitive indicator of climate change. Its presence or its retreat has a strong impact on air-sea interactions, the Earth’s energy budget as well as marine ecosystems. It is recognized by the Global Climate Observing System as an Essential Climate Variable. Sea ice edge and type are some of the parameters used to characterise sea ice.
Interval/period: N/A
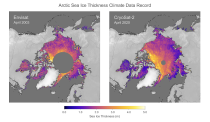
This dataset provides monthly gridded data of sea ice thickness for the Arctic region based on satellite radar altimetry observations. Sea ice is an important component of our climate system and a sensitive indicator of climate change. Its presence or its retreat has a strong impact on air-sea interactions, the Earth’s energy budget as well as marine ecosystems. It is recognized by the Global Climate Observing System as an Essential Climate Variable.
Interval/period: N/A
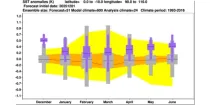
The sea surface temperature is from the ensemble control run only. Sea surface temperature evolves according to a two-way coupled ocean-atmosphere system. Sea (or lake) surface temperature are also shown (ºC)...
Interval/period: N/A
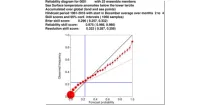
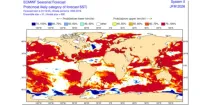
The reliability diagram shows the reliability of the ECMWF seasonal forecast system (SEAS5) with ...
Interval/period: N/A
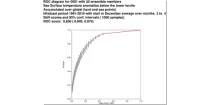
This chart shows the Relative Operating Characteristics (ROC) diagram for the three-month ...
Interval/period: N/A
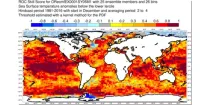
This chart shows the spatial variation in the Relative Operating Characteristics (ROC) skill ...
Interval/period: N/A
The ECMWF seasonal forecasts (SEAS5) are produced every month with a 51-member ensemble at a ...
Interval/period: N/A
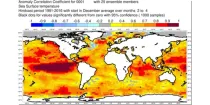
This chart shows the spatial variation in the Anomaly Correlation Coefficient (ACC) for the ...
Interval/period: N/A
The ECMWF seasonal forecasts (SEAS5) are produced every month with a 51-member ensemble at ...
Interval/period: N/A

Forecasts using IFS EPS CY47R3b replicating operations (51 members, TCo639, ORCA025Z75). These forecasts were run after the HPCF move to Bologna on the ATOS system, and therefore are not necessarily bit-identical to the operational forecasts at the time - but are statistically equivalent. The ocean state has had a hydrostatically balanced estimate of anthropogenic influence (warming) since 1850-1900 added, such that the total anthropogenic influence is twice estimated at the present day (an equal but opposite perturbation to expid b2r1).
Interval/period: N/A
Forecasts using IFS EPS CY47R3b replicating operations (51 members, TCo639, ORCA025Z75). These forecasts were run after the HPCF move to Bologna on the ATOS system, and therefore are not necessarily bit-identical to the operational forecasts at the time - but are statistically equivalent. The ocean state has had a hydrostatically balanced estimate of anthropogenic influence (warming) since 1850-1900 added, such that the total anthropogenic influence is twice estimated at the present day (an equal but opposite perturbation to expid b2r8).
Interval/period: N/A
Forecasts using IFS EPS CY47R3b replicating operations (51 members, TCo639, ORCA025Z75). These forecasts were run after the HPCF move to Bologna on the ATOS system, and therefore are not necessarily bit-identical to the operational forecasts at the time - but are statistically equivalent. The ocean state has had a hydrostatically balanced estimate of anthropogenic influence (warming) since 1850-1900 removed. The CO2 concentration was set to 285 ppm.
Interval/period: N/A
Forecasts using IFS EPS CY47R3b replicating operations (51 members, TCo639, ORCA025Z75). These forecasts were run after the HPCF move to Bologna on the ATOS system, and therefore are not necessarily bit-identical to the operational forecasts at the time - but are statistically equivalent. These forecasts are part of a series of perturbed forecast experiments designed to explore and quantify human influence on exterme weather.
Interval/period: N/A
A Baseline for Global Weather and Climate Simulations at 1 km Resolution, data is aggregated/truncated to 9km, and avail 3-hourly, above 300hPa only upper level U wind is correct, meridional winds and vorticity/divergence is corrupted. see the paper https://agupubs.onlinelibrary.wiley.com/doi/full/10.1029/2020MS002192
Examples
Interval/period: N/A
A Baseline for Global Weather and Climate Simulations at 1 km Resolution, data is aggregated/truncated to 9km, and avail 3-hourly. see the paper https://agupubs.onlinelibrary.wiley.com/doi/full/10.1029/2020MS002192
Examples
Interval/period: N/A
Comparison reference to 'A Baseline for Global Weather and Climate Simulations at 1 km Resolution', data is not aggregated and archived at 4.5km, avail 3-hourly. see also the paper https://agupubs.onlinelibrary.wiley.com/doi/full/10.1029/2020MS002192
Examples
Interval/period: N/A
A Baseline for Global Weather and Climate Simulations at 1 km Resolution, data is the reference at 9km with convection parametrisation, NDJF avail 3-hourly. see the paper https://agupubs.onlinelibrary.wiley.com/doi/full/10.1029/2020MS002192
Examples
Interval/period: N/A

Interval/period: N/A
Interval/period: N/A