Datasets

Interval/period: N/A
Interval/period: N/A
Interval/period: N/A
Interval/period: N/A
Detailed information on these EXPERIMENTAL products can be found
Interval/period: N/A
Detailed information on these EXPERIMENTAL products can be found
Interval/period: N/A
b'Detailed information on these EXPERIMENTAL products can be found
Interval/period: N/A
Detailed information on these EXPERIMENTAL products can be found
Interval/period: N/A

Various thermall comfort parameters showing thermal comfort
Interval/period: N/A
This product is derived from an ensemble of 50 model runs plus Control. Visibility is an ...
Interval/period: N/A

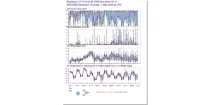
Simulated visible images show simulations of the upward flux of radiation (as would be detected by a weather satellite) derived from information using the model representation of temperatures and cloud layers.
Interval/period: N/A
(Next AIFS version v2) AIFS ENS Meteograms show a probabilistic interpretation of the AIFS ENS forecasts for specific locations using a box and whisker plot. It shows the time evolution of the distribution of several meteorological parameters on a single diagram...
Interval/period: N/A

Forecasts using IFS EPS CY47R2 replicating operations (TCo639, ORCA025Z75). In this experiment, 251 members are forecast, rather than the usual 51. The ocean state has had a hydrostatically balanced estimate of anthropogenic influence (warming) since 1850-1900 added, such that the total anthropogenic influence is twice estimated at the present day (an equal but opposite perturbation to expid b2mg). The CO2 concentration was set to 615 ppm.
Interval/period: N/A
Forecasts using IFS EPS CY47R2 replicating operations (TCo639, ORCA025Z75). In this experiment, 251 members are forecast, rather than the usual 51. The ocean state has had a hydrostatically balanced estimate of anthropogenic influence (warming) since 1850-1900 removed. The CO2 concentration was set to 285 ppm. If you are interested in using these data, please let us know by contacting nicholas.leach@physics.ox.ac.uk .
Examples
Interval/period: N/A
101-member coupled IFS (cycle 47R3) subseasonal reforecasts covering the period 2001-2020 with forecasts initialized on February 1st, May 1st, August 1st, and November 1st. The atmosphere is configured with 137 vertical levels and uses the Tco319 cubic octahedral reduced Gaussian grid. The IFS is coupled hourly to the 75 level version of the NEMO v3.4 ocean model and the LIM2 sea-ice model, both of which use the ORCA025 tripolar grid. Coupling follows the implementation used in ECMWF CY47R3 operational reforecasts.
Interval/period: N/A

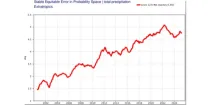
This diagram gives a measure of the effectiveness of the model by showing how far ahead in the ...
Interval/period: N/A
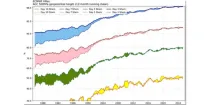
This diagram gives a measure of the effectiveness of the model by showing when the 1-SEEPS of ...
Interval/period: N/A
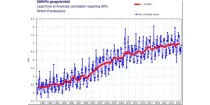
This diagram gives a measure of the effectiveness of the model by showing when the ACC of 500 ...
Interval/period: N/A
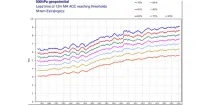
This diagram gives a measure of the effectiveness of the model by showing when the ACC of ...
Interval/period: N/A
This diagram gives a measure of the effectiveness of the model in forecasting 500 hPa heights at ...
Interval/period: N/A

This diagram gives a measure of the effectiveness of the model by showing when the ACC of 500 ...
Interval/period: N/A
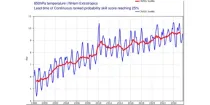
This diagram gives a measure of the effectiveness of the model by showing how far ahead in the ...
Interval/period: N/A

This diagram gives a measure of the effectiveness of the model by showing when the 1-SEEPS of ...
Interval/period: N/A
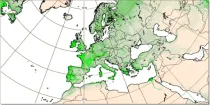
The leaf area index determines the degree of evapotranspiration. The index varies in a climatological way in the model, month by month (and so will not change in a different way if there is anomalous weather)...
Interval/period: N/A
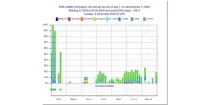
Lightning flash densities are diagnosed from forecast values of hydrometeor content, CAPE (convective available potential energy), and cloud base height that has been output by the convection scheme...
Interval/period: N/A