
Datasets
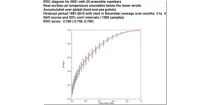
This chart shows the Relative Operating Characteristics (ROC) diagram for the three-month ...
Interval/period: N/A
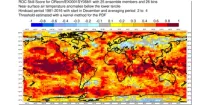
This chart shows the spatial variation in the Relative Operating Characteristics (ROC) skill ...
Interval/period: N/A
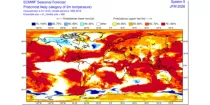
The ECMWF seasonal forecasts (SEAS5) are produced every month with a 51-member ensemble at a ...
Interval/period: N/A

Four-month 15-member ensemble hind-casts initialised on 1st of October 1992-2020. Fully radiatively interactive ozone. produced by the hybrid linear ozone scheme. IFS cycle 47r1 used. Output for pressure-level and surface fields is 6-hourly.
Examples
Interval/period: N/A
Four-month 15-member ensemble hind-casts initialised on 1st of October 1992-2020. Ozone monthly-mean zonal-mean climatology used in radiation. IFS cycle 47r1 used. Output for pressure-level and surface fields is 6-hourly.
Examples
Interval/period: N/A
This experiment contains 20 years of re-forecasts with 9 start dates twice a week between 12 December and 12 January of the following year. ensemble size is 11 members.
Examples
Interval/period: N/A
This experiment contains 20 years of re-forecasts with 9 start dates twice a week between 12 December and 12 January of the following year. ensemble size is 11 members.
Examples
Interval/period: N/A
This experiment contains 20 years of re-forecasts with 9 start dates twice a week between 12 December and 12 January of the following year. ensemble size is 11 members.
Examples
Interval/period: N/A
This experiment contains 20 years of re-forecasts with 9 start dates twice a week between 12 December and 12 January of the following year. ensemble size is 11 members.
Examples
Interval/period: N/A
This experiment contains 20 years of re-forecasts with 9 start dates twice a week between 12 December and 12 January of the following year. ensemble size is 11 members.
Examples
Interval/period: N/A
This experiment contains 20 years of re-forecasts with 9 start dates twice a week between 12 December and 12 January of the following year. ensemble size is 11 members.
Examples
Interval/period: N/A
This experiment contains 20 years of re-forecasts with 9 start dates twice a week between 12 December and 12 January of the following year. ensemble size is 11 members.
Examples
Interval/period: N/A
This experiment contains 20 years of re-forecasts with 9 start dates twice a week between 12 December and 12 January of the following year. ensemble size is 11 members.
Examples
Interval/period: N/A
This experiment contains 20 years of re-forecasts with 9 start dates twice a week between 12 December and 12 January of the following year. ensemble size is 11 members.
Examples
Interval/period: N/A
This experiment contains 20 years of re-forecasts with 9 start dates twice a week between 12 December and 12 January of the following year. ensemble size is 11 members.
Examples
Interval/period: N/A
This experiment contains 20 years of re-forecasts with 9 start dates twice a week between 12 December and 12 January of the following year. ensemble size is 11 members.
Examples
Interval/period: N/A
This experiment contains 20 years of re-forecasts with 9 start dates twice a week between 12 December and 12 January of the following year. ensemble size is 11 members.
Examples
Interval/period: N/A
This experiment contains 20 years of re-forecasts with 9 start dates twice a week between 12 December and 12 January of the following year. ensemble size is 11 members.
Examples
Interval/period: N/A
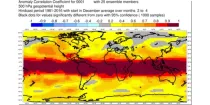
This chart shows the spatial variation in the Anomaly Correlation Coefficient (ACC) for the ...
Interval/period: N/A

A set of experiments from four centres: ECMWF, Météo-France, EDF and Met Office. The experiments are 120 day runs from 9 consecutive starting days, with write-ups every 24 hours of Pressure level and Surface data.
Interval/period: N/A

The DestinE Digital Twin for Climate Change Adaptation (Climate DT) supports adaptation activities by providing innovative climate information on multi-decadal timescales, globally, at scales at which many impacts of climate change are observed. It combines cutting-edge global Earth-system models, impact-sector applications and observations into a unified framework to provide global climate projections and impact-sector information on multi-decadal timescales (1990 to ~2050), at very high spatial resolutions (5 to 10 km).
Interval/period: N/A
The DestinE Digital Twin for Climate Change Adaptation (Climate DT) supports adaptation activities by providing innovative climate information on multi-decadal timescales, globally, at scales at which many impacts of climate change are observed. It combines cutting-edge global Earth-system models, impact-sector applications and observations into a unified framework to provide global climate projections and impact-sector information on multi-decadal timescales (1990 to ~2050), at very high spatial resolutions (5 to 10 km).
Interval/period: N/A
The DestinE Digital Twin for Climate Change Adaptation (Climate DT) supports adaptation activities by providing innovative climate information on multi-decadal timescales, globally, at scales at which many impacts of climate change are observed. It combines cutting-edge global Earth-system models, impact-sector applications and observations into a unified framework to provide global climate projections and impact-sector information on multi-decadal timescales (1990 to ~2050), at very high spatial resolutions (5 to 10 km).
Interval/period: N/A
The DestinE Digital Twin for Climate Change Adaptation (Climate DT) supports adaptation activities by providing innovative climate information on multi-decadal timescales, globally, at scales at which many impacts of climate change are observed. It combines cutting-edge global Earth-system models, impact-sector applications and observations into a unified framework to provide global climate projections and impact-sector information on multi-decadal timescales (1990 to ~2050), at very high spatial resolutions (5 to 10 km).
Interval/period: N/A
The DestinE Digital Twin for Climate Change Adaptation (Climate DT) supports adaptation activities by providing innovative climate information on multi-decadal timescales, globally, at scales at which many impacts of climate change are observed. It combines cutting-edge global Earth-system models, impact-sector applications and observations into a unified framework to provide global climate projections and impact-sector information on multi-decadal timescales (1990 to ~2050), at very high spatial resolutions (5 to 10 km).
Interval/period: N/A