
Datasets
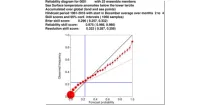
The reliability diagram shows the reliability of the ECMWF seasonal forecast system (SEAS5) with ...
Interval/period: N/A
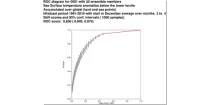
This chart shows the Relative Operating Characteristics (ROC) diagram for the three-month ...
Interval/period: N/A
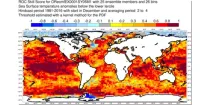
This chart shows the spatial variation in the Relative Operating Characteristics (ROC) skill ...
Interval/period: N/A
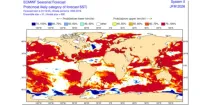
The ECMWF seasonal forecasts (SEAS5) are produced every month with a 51-member ensemble at a ...
Interval/period: N/A
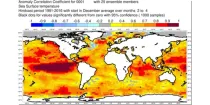
This chart shows the spatial variation in the Anomaly Correlation Coefficient (ACC) for the ...
Interval/period: N/A
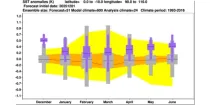
The ECMWF seasonal forecasts (SEAS5) are produced every month with a 51-member ensemble at ...
Interval/period: N/A

Forecasts using IFS EPS CY47R3b replicating operations (51 members, TCo639, ORCA025Z75). These forecasts were run after the HPCF move to Bologna on the ATOS system, and therefore are not necessarily bit-identical to the operational forecasts at the time - but are statistically equivalent. The ocean state has had a hydrostatically balanced estimate of anthropogenic influence (warming) since 1850-1900 added, such that the total anthropogenic influence is twice estimated at the present day (an equal but opposite perturbation to expid b2r1).
Interval/period: N/A
Forecasts using IFS EPS CY47R3b replicating operations (51 members, TCo639, ORCA025Z75). These forecasts were run after the HPCF move to Bologna on the ATOS system, and therefore are not necessarily bit-identical to the operational forecasts at the time - but are statistically equivalent. The ocean state has had a hydrostatically balanced estimate of anthropogenic influence (warming) since 1850-1900 added, such that the total anthropogenic influence is twice estimated at the present day (an equal but opposite perturbation to expid b2r8).
Interval/period: N/A
Forecasts using IFS EPS CY47R3b replicating operations (51 members, TCo639, ORCA025Z75). These forecasts were run after the HPCF move to Bologna on the ATOS system, and therefore are not necessarily bit-identical to the operational forecasts at the time - but are statistically equivalent. The ocean state has had a hydrostatically balanced estimate of anthropogenic influence (warming) since 1850-1900 removed. The CO2 concentration was set to 285 ppm.
Interval/period: N/A
Forecasts using IFS EPS CY47R3b replicating operations (51 members, TCo639, ORCA025Z75). These forecasts were run after the HPCF move to Bologna on the ATOS system, and therefore are not necessarily bit-identical to the operational forecasts at the time - but are statistically equivalent. The ocean state has had a hydrostatically balanced estimate of anthropogenic influence (warming) since 1850-1900 removed. The CO2 concentration was set to 285 ppm.
Interval/period: N/A
Forecasts using IFS EPS CY47R3b replicating operations (51 members, TCo639, ORCA025Z75). These forecasts were run after the HPCF move to Bologna on the ATOS system, and therefore are not necessarily bit-identical to the operational forecasts at the time - but are statistically equivalent. These forecasts are part of a series of perturbed forecast experiments designed to explore and quantify human influence on exterme weather.
Interval/period: N/A
Forecasts using IFS EPS CY47R3b replicating operations (51 members, TCo639, ORCA025Z75). These forecasts were run after the HPCF move to Bologna on the ATOS system, and therefore are not necessarily bit-identical to the operational forecasts at the time - but are statistically equivalent. These forecasts are part of a series of perturbed forecast experiments designed to explore and quantify human influence on exterme weather.
Interval/period: N/A
A Baseline for Global Weather and Climate Simulations at 1 km Resolution, data is aggregated/truncated to 9km, and avail 3-hourly, above 300hPa only upper level U wind is correct, meridional winds and vorticity/divergence is corrupted. see the paper https://agupubs.onlinelibrary.wiley.com/doi/full/10.1029/2020MS002192
Examples
Interval/period: N/A
A Baseline for Global Weather and Climate Simulations at 1 km Resolution, data is aggregated/truncated to 9km, and avail 3-hourly. see the paper https://agupubs.onlinelibrary.wiley.com/doi/full/10.1029/2020MS002192
Examples
Interval/period: N/A
Comparison reference to 'A Baseline for Global Weather and Climate Simulations at 1 km Resolution', data is not aggregated and archived at 4.5km, avail 3-hourly. see also the paper https://agupubs.onlinelibrary.wiley.com/doi/full/10.1029/2020MS002192
Examples
Interval/period: N/A
A Baseline for Global Weather and Climate Simulations at 1 km Resolution, data is the reference at 9km with convection parametrisation, NDJF avail 3-hourly. see the paper https://agupubs.onlinelibrary.wiley.com/doi/full/10.1029/2020MS002192
Examples
Interval/period: N/A

Interval/period: N/A
Interval/period: N/A
Interval/period: N/A
Interval/period: N/A
Interval/period: N/A
Interval/period: N/A
Interval/period: N/A
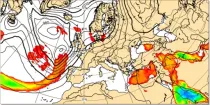
These charts show indices which indicate the susceptibility of the troposphere to support free convection. Typical values of the different indices depend on location and...
Interval/period: N/A
Forecasts using IFS EPS CY47R2 replicating operations (TCo639, ORCA025Z75). In this experiment, 251 members are forecast, rather than the usual 51. If you are interested in using these data, please let us know by contacting nicholas.leach@physics.ox.ac.uk .
Examples
Interval/period: N/A