
Datasets

TCo399 experiment assimilating GNSS-RO observations between 20201001-20210430.
Examples
retrieve, anoffset=12, class=rd, date=2020-10-01/to/2021-04-30, expver=ibwq, levelist=1/2/3/5/7/10/20/30/50/70/100/150/200/250/300/400/500/600/700/800/850/900/925/950/1000, levtype=pl, param=129.128, step=0, stream=lwda, time=09:00:00/21:00:00, type=4v, target="output"Retrieve geopotential analysis fields on pressure levels
Interval/period: N/A
TCo399 experiment assimilating GNSS-RO observations between 20211001-20220430.
Examples
retrieve, anoffset=12, class=rd, date=2021-10-01/to/2022-04-30, expver=ibyp, levelist=1/2/3/5/7/10/20/30/50/70/100/150/200/250/300/400/500/600/700/800/850/900/925/950/1000, levtype=pl, param=129.128, step=0, stream=lwda, time=09:00:00/21:00:00, type=4v, target="output"Retrieve geopotential analysis fields on pressure levels
Interval/period: N/A
TCo399 experiment assimilating GNSS-RO observations between 20221001-20230430.
Examples
retrieve, anoffset=12, class=rd, date=2022-10-01/to/2023-04-30, expver=ic0u, levelist=1/2/3/5/7/10/20/30/50/70/100/150/200/250/300/400/500/600/700/800/850/900/925/950/1000, levtype=pl, param=129.128, step=0, stream=lwda, time=09:00:00/21:00:00, type=4v, target="output"Retrieve geopotential analysis fields on pressure levels
Interval/period: N/A
TCo399 experiment assimilating GNSS-RO observations between 20231001-20240430.
Examples
retrieve, anoffset=12, class=rd, date=2023-10-01/to/2024-04-30, expver=ic2f, levelist=1/2/3/5/7/10/20/30/50/70/100/150/200/250/300/400/500/600/700/800/850/900/925/950/1000, levtype=pl, param=129.128, step=0, stream=lwda, time=09:00:00/21:00:00, type=4v, target="output"Retrieve geopotential analysis fields on pressure levels
Interval/period: N/A
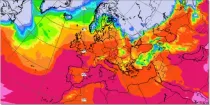
These charts represent the height of the air temperature 0°C isotherm or the Wet bulb temperature 0°C isotherm...
Interval/period: N/A
Atmosphere only forecast experiment with updated observed sea ice concentration from the ECMWF operational analysis. 10-day high resolution (TCo1279) forecast experiments performed with Cy46r1 of the ECMWF-IFS were initialised at 0z for DJFM2017/18.
Examples
retrieve, class=rd, stream=oper, expver=hmgx, type=fc, levtype=sfc, param=2t, date=2017-12-01, time=00:00:00, step=24, target='output.grib'retrieve 2m temperature at 24 hours into the forecast
Interval/period: N/A
Atmosphere only forecast experiment with sea ice concentration persisted from the ECMWF operational analysis. 10-day high resolution (TCo1279) forecast experiments performed with Cy46r1 of the ECMWF-IFS were initialised at 0z for DJFM2017/18.
Examples
retrieve, class=rd, stream=oper, expver=hdvq, type=fc, levtype=sfc, param=2t, date=2017-12-01, time=00:00:00, step=24, target='output.grib'retrieve 2m temperature at 24 hours into the forecast
Interval/period: N/A
Coupled atmosphere-ice-ocean forecast experiment. SSTs partially coupled in the extratropics. 10-day high resolution (TCo1279) forecast experiments performed with Cy46r1 of the ECMWF-IFS were initialised at 0z for DJFM2017/18.
Examples
retrieve, class=rd, stream=oper, expver=hdwl, type=fc, levtype=sfc, param=2t, date=2017-12-01, time=00:00:00, step=24, target='output.grib'retrieve 2m temperature at 24 hours into the forecast
Interval/period: N/A
High-resolution forecast experiment
Examples
retrieve, class=rd, stream=oper, expver=i4ql, type=fc, levtype=sfc, param=2t, date=2023-10-11/to/2023-10-29, time=00:00:00, step=0/1/2/3/4, area=80/-20/20/30, grid=0.05/0.05, target='output.grib'Download 2m temperature
Interval/period: N/A
This dataset contains parameters from four-month long seasonal reforecasts using ECMWF IFS cycle CY49R1 v-version 4 covering the period 1993-2019 and forced with datasets for Leaf Area Index (LAI) and Land Use/Land Cover (LULC) developed in the CONFESS project (https://confess-h2020.eu). The reforecasts uses time varying LAI and LULC based on version climate.v020_ESACCI_LAI of the IFS climate fields and can be compared against the CONTROL experiment (i14x) that uses climatological LAI and fixed LULC.
Interval/period: N/A
This dataset provides output from a 10-member ensemble global atmosphere simulation covering the period 1980 to 2023 produced with the European Centre for Medium-Range Weather Forecasts (ECMWF) Integrated Forecasting System (IFS), using a Tco399 L137 configuration of the IFS, which has an average horizontal grid spacings of ∼28 km. The simulation is constrained by time-evolving external climate forcings, including observed greenhouse gas and aerosol concentrations.
Interval/period: N/A
This dataset provides output from a 10-member ensemble global atmosphere simulation covering the period 1980 to 2023 produced with the European Centre for Medium-Range Weather Forecasts (ECMWF) Integrated Forecasting System (IFS), using a Tco399 L137 configuration of the IFS, which has an average horizontal grid spacings of ∼28 km. The simulation is constrained by time-evolving external climate forcings, including observed greenhouse gas and aerosol concentrations.
Interval/period: N/A
This dataset provides output from a single member global atmosphere simulation covering the period 1980 to 2023 produced with the European Centre for Medium-Range Weather Forecasts (ECMWF) Integrated Forecasting System (IFS), using a Tco399 L137 configuration of the IFS, which has an average horizontal grid spacings of ∼9 km. The simulation is constrained by time-evolving external climate forcings, including observed greenhouse gas and aerosol concentrations.
Interval/period: N/A
This dataset provides output from a 10-member ensemble global atmosphere reference simulation covering the period 1980 to 2023 produced with the European Centre for Medium-Range Weather Forecasts (ECMWF) Integrated Forecasting System (IFS), using a Tco399 L137 configuration of the IFS, which has an average horizontal grid spacings of ∼28 km.
Interval/period: N/A
This dataset provides output from a single member global atmosphere reference simulation covering the period 1980 to 2023 produced with the European Centre for Medium-Range Weather Forecasts (ECMWF) Integrated Forecasting System (IFS), using a Tco1279 L137 configuration of the IFS, which has an average horizontal grid spacings of ∼9 km.
Interval/period: N/A
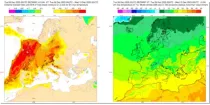
These charts show areas where anomalous 2 m maximum temperatures are likely to occur. These charts are based on the ECMWF ensem ...
Interval/period: N/A
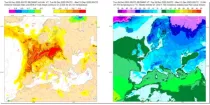
These charts show areas where anomalous 2 m minimum temperatures are likely to occur. These charts are based on the ECMWF ensem ...
Interval/period: N/A
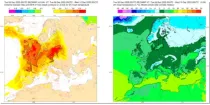
These charts show areas where anomalous 2 m temperatures are likely to occur. These charts are based on the ECMWF ensemble forecas ...
Interval/period: N/A
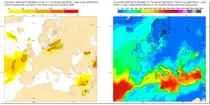
These charts show areas where anomalous CAPE are likely to occur.
Interval/period: N/A
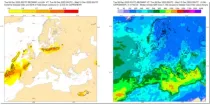
These charts show areas where anomalous CAPE Shear are likely to occur.
Interval/period: N/A
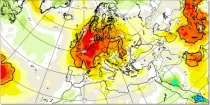
This chart aims to highlight areas where unusually anomalous 2 metre temperatures are ...
Interval/period: N/A
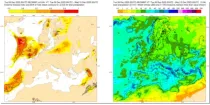
These charts aim to provide pointers to areas where anomalous precipitation amounts are likely to occur during the 24 hour, 2 day, 5 day or 10 day period previous to the selected validity time...
Interval/period: N/A
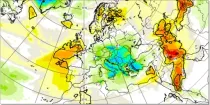
This chart aims to highlight areas where unusually anomalous precipitation is likely to ...
Interval/period: N/A
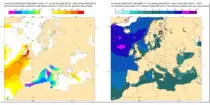
These charts show areas where anomalous significant wave heights are likely to occur. These charts are based on the ECMWF ense ...
Interval/period: N/A
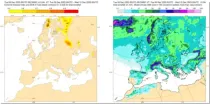
These charts show areas where anomalous snow fall is likely to occur. These charts are based on the ECMWF ensemble for ...
Interval/period: N/A