Datasets

4-month long 101-ensemble member seasonal reference experiment (R98) initialised on 01-November-1997 using the atmosphere-only version of SEAS5 (see Johnson et al., 2019) forced with daily ERA5 SST.
Examples
retrieve, class=rd, date=1997-11-01, expver=hosm, fcmonth=1/2/3/4, levtype=pl, levelist=500, method=1, number=0/to/100, origin=ecmf, param=z, stream=msmm, system=5, time=00:00:00, type=fcmean, target="output_z500.grib"Monthly mean Geopotential at 500 hPa
Interval/period: N/A
4-month long 101-ensemble member seasonal reference experiment (R16) initialised on 01-November-2015 using the atmosphere-only version of SEAS5 (see Johnson et al., 2019) forced with daily ERA5 SST.
Examples
retrieve, class=rd, date=2015-11-01, expver=hosn, fcmonth=1/2/3/4, levtype=pl, levelist=500, method=1, number=0/to/100, origin=ecmf, param=z, stream=msmm, system=5, time=00:00:00, type=fcmean, target="output_z500.grib"Monthly mean Geopotential at 500 hPa
Interval/period: N/A
4-month long 101-ensemble member seasonal reference experiment (R20) initialised on 01-November-2019 using the atmosphere-only version of SEAS5 (see Johnson et al., 2019) forced with daily ERA5 SST.
Examples
retrieve, class=rd, date=2019-11-01, expver=hosi, fcmonth=1/2/3/4, levtype=pl, levelist=500, method=1, number=0/to/100, origin=ecmf, param=z, stream=msmm, system=5, time=00:00:00, type=fcmean, target="output_z500.grib"Monthly mean Geopotential at 500 hPa
Interval/period: N/A
**Note:** In **June 2023** ECMWF implemented a **major upgrade ...**
Interval/period: N/A
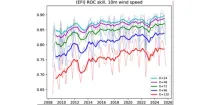
This diagram shows the variation of Relative Operating Characteristics (ROC) scores with various ...
Interval/period: N/A
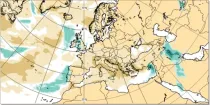
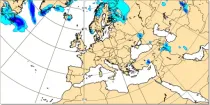
This chart shows the anomaly in precipitation (in mm of rainfall or rainfall equivalent) during a 24 hour period immediately prior to the chosen valid date/time...
Interval/period: N/A
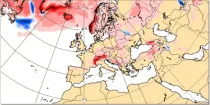
This chart shows the anomaly in snowfall (in mm of rainfall equivalent) during a 24 hour period immediately prior to the chosen valid date/time...
Interval/period: N/A
Forecast precipitation is considered to be snow if the model atmosphere above and at the ground surface is forecast to be below 0°C. Where the ground surface lies near the 0°C level...
Interval/period: N/A

Mean total swell wave direction is the spectrally averaged propagation direction of the swell waves (weighted by wave height) of the part of the spectrum that is NOT windsea...
Interval/period: N/A

Wave height is the vertical distance between trough and crest. Wave period is the time between the passage of one wave crest and the next. The arrow direction is the direction the waves are moving towards...
Interval/period: N/A
These charts provide information on current Tropical Cyclone activity. Select the ...
Interval/period: N/A
This chart shows the potential for tropical cyclone activity at different time ranges during the ...
Interval/period: N/A
Tropical relaxation experiment run at Tco199 for 46 days over 20 years starting on 12, 16 , 19, 23, 26 , 30 December and 2nd, 6th and 9th January 1999-2018.
Examples
retrieve, class=rd, stream=enfh, expver=iknn, type=pf, number=1/to/4, levtype=sfc, param=2t, date=20191212, hdate=20091212, time=00:00:00, step=24, target='output.grib'Retrieving 2-meter temperature of the hindcast starting on 12 December 2019 for all perturbed members.
Interval/period: N/A

The ECMWF seasonal forecasts (SEAS5) are produced every month with a 51-member ensemble at a ...
Interval/period: N/A

The ECMWF seasonal forecasts (SEAS5) are produced every month with a 51-member ensemble at a ...
Interval/period: N/A

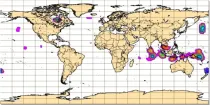
The charts show mean frequency and accumulated cyclone energy of tropical storm activity. ...
Interval/period: N/A

This chart provides information on the verification of forecasts of the expected number of ...
Interval/period: N/A

The charts show the evolution of existing and potential tropical cyclone activity. ...
Interval/period: N/A

Single forecast runs produced by the ECMWF Artificial Intelligence Forecasting System (AIFS) deterministic model.
Interval/period: N/A
On 12 May 2026, a new forecast stream will be produced by ECMWF's operational Artificial Intelligence Forecasting System deterministic model (AIFS Single).
The new forecast stream is for wave forecast runs, marking ECMWF's first operational data-driven wave forecasts.
Interval/period: N/A
ECMWF is now running its own Artificial Intelligence Forecasting System (AIFS). The AIFS consists of a deterministic model and an ensemble model. The deterministic model has been running operationally since 25 February 2025; further details can be found on the dedicated Implementation of AIFS Single v1 page.
Interval/period: N/A
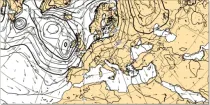
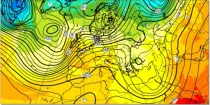
These charts show surface pressure patterns. Areas of high pressure (anticyclones) are usually associated with settled weather...
Interval/period: N/A
Dew Point Temperature at 2 m above the earth’s surface gives an indication of conditions which a person will experience or feel. High dewpoint temperatures inhibit heat loss from the body by perspriation and...
Interval/period: N/A
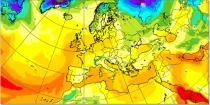
Temperatures at 2 m above the earth’s surface and winds at 10 m above the earth’s surface approximate most closely to the conditions that a person would experience.
Interval/period: N/A
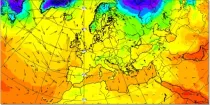
The 850 hPa level is usually just above the boundary layer and at this level the day-night variation in temperature is generally negligible...
Interval/period: N/A