Datasets
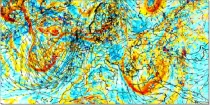
The movement or transfer of vorticity helps in the assessment of vertical motion of air (ascent) in the troposphere. Where a local vorticity maximum approaches an area there is a tendency for air to rise and where a local vorticity maximum moves ...
Interval/period: N/A
Vorticity is the tendency of an air particle to rotate or circulate around a particular point. Relative Vorticity is a measure about a vertical axis of the local rotation or spin of the air relative...
Interval/period: N/A
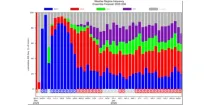
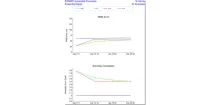
This diagram shows daily probabilities for four types of Euro-Atlantic weather regimes over ...
Interval/period: N/A
The DestinE Digital Twin for Weather-Induced Extremes (Extremes DT) supports responding and adapting to extreme events in a changing world by providing a capability to produce tailored simulations and address what-if scenarios related to extreme events in a past, present and future climate, complementing existing capabilities at national and European level.
Interval/period: N/A
**Note:** In **June 2023** ECMWF implemented a **major upgrade ...**
Interval/period: N/A
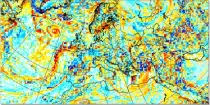
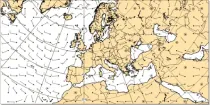
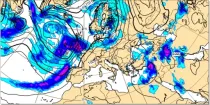
The air flow is not the same at all levels and can be very different in strength and direction when associated with vigorous weather systems...
Interval/period: N/A
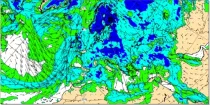
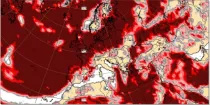
Uncoloured areas (relative humidity < 65%) are likely to be free of cloud. Coloured areas (relative humidity > 65%) show where moisture is likely to be available for cloud development...
Interval/period: N/A
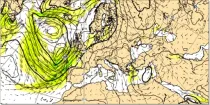
This chart shows 7-day mean anomalies of wind speed and direction from the ECMWF Sub-seasonal ...
Interval/period: N/A

Mean windsea wave direction is the spectrally averaged direction of propagation of the windsea waves (weighted by wave height). Arrow length is proportional to the speed of wave propagation...
Interval/period: N/A

Significant windsea wave height can be shown to correspond to the average wave height of the top one-third highest windsea waves. Wave heights are shown in metres using colour shading...
Interval/period: N/A

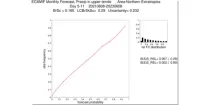
A routine inter-comparison of wave model forecast verification data was first established in 1995, developed around the exchange of model forecast data at an agreed list of moored buoy sites at which instrumented observations of significant wave height, wave period and wind speed are available over the WMO GTS.
Interval/period: N/A
**Note:** In **June 2023** ECMWF implemented a **major upgrade ...**
Interval/period: N/A
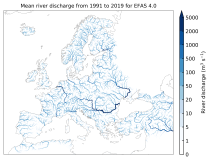
This dataset provides gridded modelled hydrological time series forced with medium-range meteorological forecasts. The data is a consistent representation of the most important hydrological variables across the European Flood Awareness System (EFAS) domain. The temporal resolution is sub-daily high-resolution and ensemble forecasts of:
River discharge
Soil moisture for three soil layers
Snow water equivalent
Interval/period: N/A
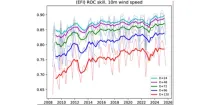
This diagram gives a measure of the effectiveness of the model. The drop-down menu can ...
Interval/period: N/A
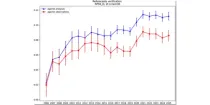
This diagram gives a measure of the effectiveness of the model. ...
Interval/period: N/A
**Note:** In **June 2023** ECMWF implemented a **major upgrade ...**
Interval/period: N/A

SNAPSI case study of Northern Hemisphere strong polar vortex case in the stratosphere, initialised on 2022-01-01. TCo319L137 resolution 51-member ensemble, integrated for 70 days.
Examples
Interval/period: N/A
SNAPSI case study of Northern Hemisphere strong polar vortex case in the stratosphere, initialised on 2022-01-01. TCo319L137 resolution 51-member ensemble, integrated for 70 days.
Examples
Interval/period: N/A

These charts show probability of various heights of significant waves 10-15 days ahead. The ...
Interval/period: N/A
This chart shows probability information regarding wind speeds at 100 m above the earth's ...
Interval/period: N/A

This chart shows probability information regarding CAPE shear derived from the ECMWF ensemble ...
Interval/period: N/A

This chart shows probability information regarding MUCAPE derived from the ECMWF ensemble (ENS) ...
Interval/period: N/A
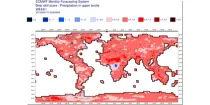
Precipitation totals include all precipitation types (rain, snow etc.) (in mm of rainfall or rainfall equivalent) falling in 6 hour or 12 hour periods using colour shading...
Interval/period: N/A

This diagram gives a measure of the effectiveness of the model. ...
Interval/period: N/A
Research analysis experiment produced with ECMWF IFS cycle 47R1, at TCo399 (25km), for the EUREC4A field campaign (15.01.2020-14.02.2020). As in the operational analysis, the radiosondes and dropsondes launched in the campaign are assimilated.
Examples
Interval/period: N/A