Datasets
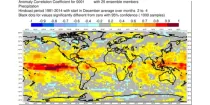
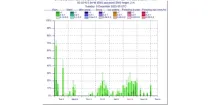
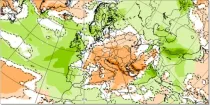
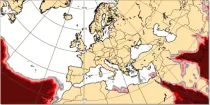
This chart shows the spatial variation in the Anomaly Correlation Coefficient (ACC) for the ...
Interval/period: N/A
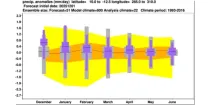
The ECMWF seasonal forecasts (SEAS5) are produced every month with a 51-member ensemble at ...
Interval/period: N/A
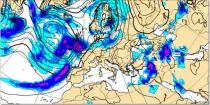
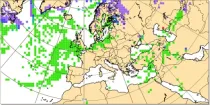
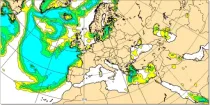
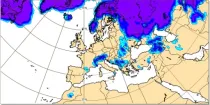
The charts show totals of large scale precipitation, convective precipitation, and the total of precipitation during the 6 hour period previous to the selected validity time...
Interval/period: N/A
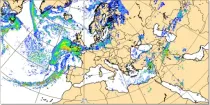
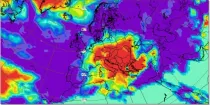
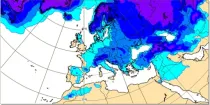
These charts show the rate of fall of large scale precipitation, the rate of fall of convective precipitation, the rate of fall of snowfall, or the rate of fall of all precipitation...
Interval/period: N/A
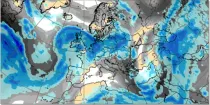
Where precipitation is forecast, a type of precipitation can be assigned according to the temperature structure of the model atmosphere that includes the layers through which the model precipitation falls...
Interval/period: N/A
This product is derived from an ensemble of 50 model runs plus Control. The chart shows ...
Interval/period: N/A
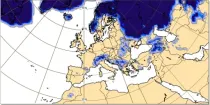
This chart shows probabilities for the 7-day mean anomalies of precipitation to be in defined ...
Interval/period: N/A
This chart shows probabilities that 7-day-total precipitation (from the 101 forecast members) ...
Interval/period: N/A
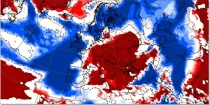
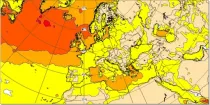
This chart shows 7-day mean anomalies of precipitation accumulation amounts from the ECMWF ...
Interval/period: N/A

A set of experiments from four centres: ECMWF, Météo-France, EDF and Met Office. The experiments are 120 day runs from 9 consecutive starting days, with write-ups every 24 hours of Pressure level and Surface data.
Interval/period: N/A

Members 1-30 of PRIMAVERA (https://www.primavera-h2020.eu/) sensitivity experiment primWP5-coupledseaice. Configured as HighResMIP/CMIP6 ECMWF-IFS-HR experiment control-1950 ( https://doi.org/10.5194/gmd-11-3681-2018) but with sea-ice albedo set to open ocean values (i.e. 0.066). Each member is run for 15 months and initialized on January 1st by branching from years 1-30 of control-1950 (i.e. there is one year of separation in start dates for each member).
Interval/period: N/A
Members 1-30 of PRIMAVERA (https://www.primavera-h2020.eu/) sensitivity experiment primWP5-coupledseaice. Configured as HighResMIP/CMIP6 ECMWF-IFS-LR experiment control-1950 ( https://doi.org/10.5194/gmd-11-3681-2018) but with sea-ice albedo set to open ocean values (i.e. 0.066). Each member is run for 15 months and initialized on January 1st by branching from years 1-30 of control-1950 (i.e. there is one year of separation in start dates for each member).
Interval/period: N/A
Members 31-40 of PRIMAVERA (https://www.primavera-h2020.eu/) sensitivity experiment primWP5-coupledseaice. Configured as HighResMIP/CMIP6 ECMWF-IFS-HR experiment control-1950 ( https://doi.org/10.5194/gmd-11-3681-2018) but with sea-ice albedo set to open ocean values (i.e. 0.066). Each member is run for 15 months and initialized on January 1st by branching from years 31-40 of control-1950 (i.e. there is one year of separation in start dates for each member).
Interval/period: N/A
Members 31-40 of PRIMAVERA (https://www.primavera-h2020.eu/) sensitivity experiment primWP5-coupledseaice. Configured as HighResMIP/CMIP6 ECMWF-IFS-LR experiment control-1950 ( https://doi.org/10.5194/gmd-11-3681-2018) but with sea-ice albedo set to open ocean values (i.e. 0.066). Each member is run for 15 months and initialized on January 1st by branching from years 31-40 of control-1950 (i.e. there is one year of separation in start dates for each member).
Interval/period: N/A
This chart shows probability information regarding 10 m wind gust derived from the ECMWF ...
Interval/period: N/A
These charts are derived from the ECMWF ensemble forecast (ENS) system and show probability of ...
Interval/period: N/A
This chart shows probability information regarding dew point temperature 2 m above the ground derived from the ECMWF ensemble (ENS) at the validity time...
Interval/period: N/A
These charts are derived from the ECMWF ensemble forecast (ENS) system and show probability of 2 ...
Interval/period: N/A
These charts are derived from the ECMWF ensemble forecast (ENS) system. They show probability ...
Interval/period: N/A
The CAT (Clear Air Turbulence) parameter is given in units of the turbulent Eddy Dissipation ...
Interval/period: N/A
This chart shows probability information regarding freezing rain derived from the ECMWF ensemble ...
Interval/period: N/A

This chart shows probability information regarding lightning flash density derived from the ...
Interval/period: N/A
This chart shows probability information regarding maximum temperature 2 m above the ground derived from the ECMWF ensemble (ENS) during the 6 hour period preceding the validity time...
Interval/period: N/A

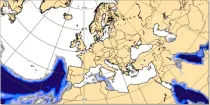
This chart shows probability information regarding mean wave period derived from the ECMWF ...
Interval/period: N/A
This chart shows probability information regarding minimum temperature 2 m above the ground derived from the ECMWF ensemble (ENS) during the 6 hour period preceding the validity time...
Interval/period: N/A