
Datasets

The Copernicus Climate Change Service (C3S) seasonal forecast service is based on data from several state-of-the-art seasonal prediction systems.
Interval/period: N/A

This is an extension of the i4ql experiment covering the period 2025-07-27 to 2023-08-10
Examples
retrieve, class=rd, stream=oper, expver=abcd, type=fc, levtype=sfc, param=2t, date=2000-01-01, time=00:00:00, step=24, target='output.grib' retrieve, class=rd, stream=oper, expver=abcd, type=fc, levtype=sfc, param=2t, date=2000-01-01, time=00:00:00, step=24, target='output.grib'Interval/period: N/A
Control experiment (CTRL) for an assimilation test with near-real time TROPOMI total column CO data (exp=hmib) using the CAMS CY47R3 configuration. In CTRL, MOPITT TIR and IASI TCCO are assimilated, but TROPOMI TCCO data are passive.
Examples
retrieve, class=rd, stream=oper, expver=hlxm, type=an, levtype=sfc, param='tcco', date=2021-08-01, time=00:00:00, step=0, target='output.grib'Retrieval of total column CO analysis
Interval/period: N/A
Analysis experiment (ASSIM) testing the assimilation of near-real time TROPOMI total column CO data in the CAMS CY47R3 system for the period 6/7-31/12/2021 (in addition to already assimilated MOPITT TIR and IASI TCCO).
Examples
retrieve, class=rd, stream=oper, expver=hmib, type=an, levtype=sfc, param='tcco', date=2021-08-01, time=00:00:00, step=0, target='output.grib'Retrieval of total column CO analysis
Interval/period: N/A
Control experiment for a series of SO2 assimilation tests for the 2019 Raikoke eruption with the CAMS system which assess the impact of assimilating SO2 layer height data (V3.1 FP_ILM). In BLexp (hhu5) ESA NRT SO2 data were assimilated.
Examples
retrieve, class=rd, stream=oper, expver=hhu5, type=fc, levtype=sfc, param=210126, date=2019-06-23, time=00:00:00, step=24, target='output.grib'Retrieval of total column SO2 forecast at step 24
Interval/period: N/A
Layer height experiment for a series of SO2 assimilation tests for the 2019 Raikoke eruption with the CAMS system which assess the impact of assimilating SO2 layer height data (V3.1 FP_ILM). In LH1.4 (hgz7) SO2 Layer Height data produced with FP_ILM (V3.1) were assimilated with SO2 background error standard deviation values of 1.4e-7 kg/kg and horizontal background error correlation length scale of 100 km.
Examples
Interval/period: N/A
Layer height experiment for a series of SO2 assimilation tests for the Raikoke eruption with the CAMS system which assess the impact of assimilating SO2 layer height data (V3.1 FP_ILM). In LH100 (hhtm) SO2 Layer Height data produced with FP_ILM (V3.1) were assimilated with SO2 background error standard deviation values of 1e-7 kg/kg and horizontal background error correlation length scale of 100 km.
Examples
Interval/period: N/A
Layer height experiment for a series of SO2 assimilation tests for the 2019 Raikoke eruption with the CAMS system which assess the impact of assimilating SO2 layer height data (V3.1 FP_ILM). In LH250 (hhtn) SO2 Layer Height data produced with FP_ILM (V3.1) were assimilated with SO2 background error standard deviation values of 1e-7 kg/kg and horizontal background error correlation length scale of 250 km.
Examples
Interval/period: N/A
Layer height experiment for a series of SO2 assimilation tests for the 2019 Raikoke eruption with the CAMS system which assess the impact of assimilating SO2 layer height data (V3.1 FP_ILM). In LH50 (hhbu) SO2 Layer Height data produced with FP_ILM (V3.1) were assimilated with SO2 background error standard deviation values of 1e-7 kg/kg and horizontal background error correlation length scale of 50 km.
Examples
Interval/period: N/A
Layer height experiment for a series of SO2 assimilation tests for the 2019 Raikoke eruption with the CAMS system which assess the impact of assimilating SO2 layer height data (V3.1 FP_ILM). In LHexp (hgze) SO2 Layer Height data produced with FP_ILM (V3.1) were assimilated with SO2 background error standard deviation values of 0.7e-7 kg/kg and horizontal background error correlation length scale of 100 km.
Examples
Interval/period: N/A
Probabilistic 15-day TCo1279L137 forecast with CY49R1.1. 8 ENS members. Control for the nudged experiments. 00/12UTC start from 1 December 2024 to 28 February 2025.
Examples
Interval/period: N/A
Probabilistic 15-day TCo1279L137 forecast with CY49R1.1. 8 ENS members. Control for the nudged experiments. 00/12UTC start from 1 July 2024 to 12 November 2024.
Examples
Interval/period: N/A
Probabilistic 15-day TCo1279L137 forecast with CY49R1.1. 8 members. Vorticity and virtual temperature below tropopause nudged to equivalent members from model level AIFS-CRPS ML model for total wavenumbers <21. 00/12UTC start from 1 July 2024 to 30 September 2024. Only perturbed forecasts should be analysed.
Examples
Interval/period: N/A
Probabilistic 15-day TCo1279L137 forecast with CY49R1.1. 8 members. Vorticity and virtual temperature below tropopause nudged to equivalent members from model level AIFS-CRPS ML model for total wavenumbers <21. 00/12UTC start from 1 December 2024 to 28 February 2025. Only perturbed forecasts should be analysed.
Examples
Interval/period: N/A
Probabilistic 15-day TCo1279L137 forecast with CY49R1.1. 8 members. Vorticity and virtual temperature below tropopause nudged to equivalent members from model level AIFS-CRPS ML model for total wavenumbers <21. 00/12UTC start from 1 October 2024 to 12 November 2024. Only perturbed forecasts should be analysed.
Examples
Interval/period: N/A
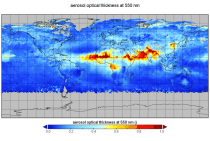
Interval/period: Thu, 06/01/1995 - Thu, 07/31/2025
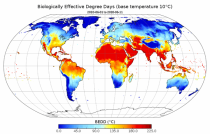
Interval/period: Mon, 01/01/1951 - Mon, 08/10/2026
Four-month 15-member ensemble hind-casts initialised on 1st of October 1992-2020. Fully radiatively interactive ozone. produced by the hybrid linear ozone scheme. IFS cycle 47r1 used. Output for pressure-level and surface fields is 6-hourly.
Examples
Interval/period: N/A
Four-month 15-member ensemble hind-casts initialised on 1st of October 1992-2020. Ozone monthly-mean zonal-mean climatology used in radiation. IFS cycle 47r1 used. Output for pressure-level and surface fields is 6-hourly.
Examples
Interval/period: N/A
This experiment contains 20 years of re-forecasts with 9 start dates twice a week between 12 December and 12 January of the following year. ensemble size is 11 members.
Examples
Interval/period: N/A
This experiment contains 20 years of re-forecasts with 9 start dates twice a week between 12 December and 12 January of the following year. ensemble size is 11 members.
Examples
Interval/period: N/A
This experiment contains 20 years of re-forecasts with 9 start dates twice a week between 12 December and 12 January of the following year. ensemble size is 11 members.
Examples
Interval/period: N/A
This experiment contains 20 years of re-forecasts with 9 start dates twice a week between 12 December and 12 January of the following year. ensemble size is 11 members.
Examples
Interval/period: N/A
This experiment contains 20 years of re-forecasts with 9 start dates twice a week between 12 December and 12 January of the following year. ensemble size is 11 members.
Examples
Interval/period: N/A
This experiment contains 20 years of re-forecasts with 9 start dates twice a week between 12 December and 12 January of the following year. ensemble size is 11 members.
Examples
Interval/period: N/A